Pan-Arctic Summary
The June Outlook for arctic sea ice in September 2010 shows reasonable arguments for either a modest increase or decrease in September 2010 sea ice extent compared to the last two years (5.4 million square kilometers in 2009 and 4.7 million square kilometers in 2008). However, it is important to note that the June 2010 Outlook indicates a continuation of the overall trend in long-term loss of summer arctic sea ice, with no indication that a return to historical levels of the 1980s/1990s will occur.
Reasoning for an increase in sea ice extent from recent years assumes that the current presence of extensive second- and third-year sea ice that we saw in winter 2009/2010 indicates a build-up of multi-year sea ice and a more stable ice pack. Reasoning for a decrease in sea ice extent from recent years, perhaps approaching new record-low minimum, focuses on the below-normal sea ice thickness overall, the thinning of sea ice in coastal seas, rotting of old multi-year sea ice, warm temperatures in April and May 2010, and the rapid loss of sea ice area seen during May.
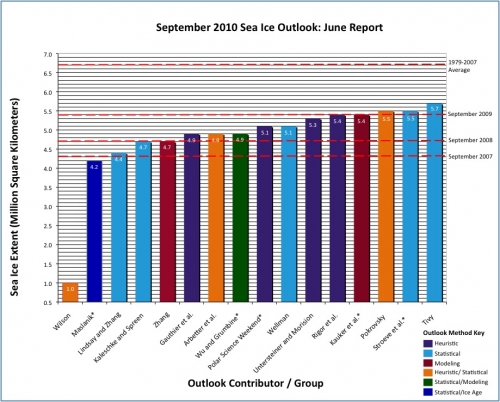
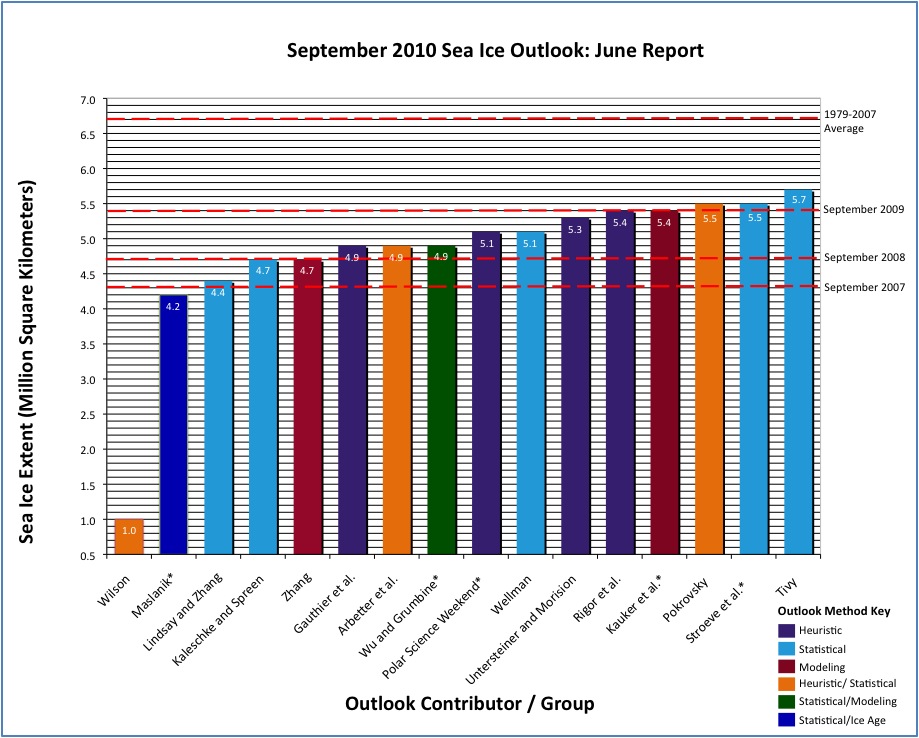
With 16 responses, the June Outlook reflected both these arguments. The range of June Outlook estimates is 4.2 to 5.7 million square kilometers, with an additional estimate of 1.0 million square kilometers (Figure 1, below).
Six respondents, with estimates of 4.9–5.3 million square kilometers, represent a prediction for persistent conditions from 2008/2009.
The remaining estimates fall into "high" and "low" extent groupings: the low extent group with a range of 4.2 to 4.7 million square kilometers, representing a continued loss of sea ice extent compared to 2008/2009, and the high extent group of 5.4 to 5.7 million square kilometers, suggesting a return to the long-term trend for summer sea ice loss.
Individual responses were based on a range of methods: statistical, numerical models, comparison with previous observations and rates of ice loss, or composites of several approaches.

Pan-Arctic Full Outlook
OVERVIEW OF RESULTS
There are reasonable arguments for either a modest increase or a decrease in September 2010 sea ice extent compared to recent years. In the popular press, reports have spanned the range from a recovery from the recent period of record minimum extents, to predictions of a new record minimum this summer. With 16 responses, the June Outlook reflected a range of thinking about the summer 2010 sea ice season, but not these extremes on each end. Reasoning for a recovery from recent years assumes that the current presence of extensive second- and third-year sea ice in winter 2009/2010 might indicate a build-up of the multi-year (more stable) ice pack. Reasoning for a new record minimum focuses on the below-normal ice thickness overall, the thinning of sea ice in coastal seas, rotting of old multi-year sea ice, and the rapid loss of sea ice area seen during May.
It is important to note for context, however, that all 2010 estimates are well below the 1979–2007 September climatological mean of 6.7 million square kilometers, and all indicate a continuation of a long-term trend in summer sea ice loss.
The range of June Outlook estimates is from 4.2 to 5.7 million square kilometers, with one additional outlook estimate of 1.0 million square kilometers (Figure 1). Six respondents, with estimates of 4.9–5.3 million square kilometers, represent a prediction for persistent conditions from 2008/2009. The remaining estimates fall into "high" and "low" extent groupings: the low extent group with a range of 4.2 to 4.7 million square kilometers, representing a continued loss of sea ice extent compared to 2008/2009, and the high extent group of 5.4 to 5.7 million square kilometers, suggesting a return to the long-term trend for summer sea ice loss. Individual responses were based on a range of methods: statistical, numerical models, comparison with previous observations and rates of ice loss, or composites of several approaches. Of interest is that the three numerical modeling methods (Kauker et al., Wu and Grumbine, and Zhang) represent examples of the high, persistence, and low outlooks. We would also like to draw attention to a recent paper by Holland et al. (see PDF at the bottom of the report) that supports the idea that there is some skill to summer seasonal forecasts.
Where provided, the uncertainty estimates are close to 0.5 million square kilometers. In the 2009 Outlook, most estimates overlapped each other when their uncertainty ranges were considered. This year there is significant separation between the high and low estimates. The goal of the Outlook is not firm forecasts, but to promote a discussion of the physics and factors of summer sea ice loss. In 2010, we are pleased at the range of discussion and thank the contributors for their efforts.

LATE SPRING 2010 CONDITIONS
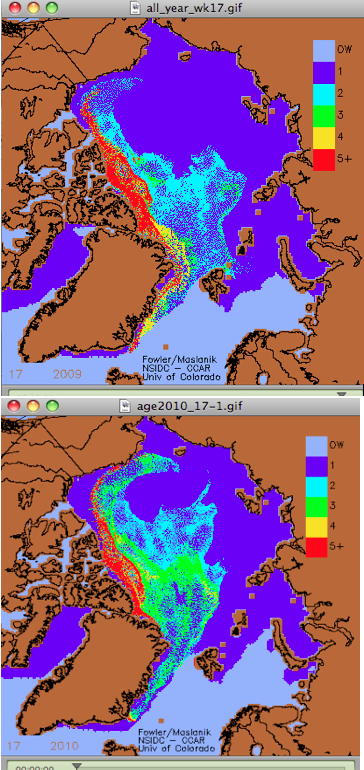
Regarding initial conditions for Spring 2010, Figure 2 by Maslanik and others shows maps of sea ice classes derived from sea ice age for April 2010 and 2009. Their approach to determining sea-ice age is based on tracking of sea ice using satellite imagery. Dark blue regions are areas of first-year sea ice. In general, the maps show that there is slightly more third-year sea ice this April than in 2009 (green). An interesting feature in both images is the tongue of old sea ice (red) extending into the southern Beaufort Sea. This feature was observed in the past three years, and airborne and ground-based surveys out of northern Alaska indicate that this is in fact old ice of well over 3 m thickness. Finding such old ice so far south in recent years is consistent with observations for increased mobility of sea ice, even in the central Arctic. The movement of old, thick sea ice to lower latitudes has a two-fold impact. Regionally, it can help delay sea ice loss, but on a pan-arctic scale it enhances overall ice melt and ice volume reduction, as these old floes melt faster at lower latitudes. The other major feature of the 2010 sea ice age map is the extensive areas of second- and third-year sea ice. Will much of this ice remain in the central basin to rebuild the area of old, perennial sea ice over the coming years?

It is unfortunate that maps of multi-year sea ice distribution for 2010 derived from QuikSCAT (provided by Nghiem) are no longer available to compare with sea ice age calculations, as in previous years. A composite product based on active (ASCAT aboard the EUMETSAT METOP satellite) and passive (SSM/I) microwave data with advanced atmospheric correction of raw data (Figure 3) shows a range of sea ice types. Major features are southwestward advection of older sea ice into the Beaufort Gyre and southwestward advection of different sea ice types toward Fram Strait in the Transpolar Drift.

Much has been made of the fact that the April 2010 sea ice extent data released by the National Snow and Ice Data Center (NSIDC) were near the long-term climatological average (Figure 4). This April increase, however, is primarily in the marginal seas of the Arctic, especially the Bering Sea, so it is unclear whether this late winter/early spring advance will have any effect on summer ice conditions. Ground-based observations in the Bering Sea indicate below-normal ice thickness this spring (see the Sea Ice for Walrus Outlook). Further, Figure 4 shows a major loss of sea ice extent through May; contributions to the loss were especially important from the Barents Sea and northern Baffin Bay (Figure 5). Such loss can be related to warm temperatures throughout the Arctic during May (Figure 6). Given the hint of a sea ice-free region near the New Siberian Islands (off the Siberian Coast) in Figure 5 and the temperature maximum in Figure 6, one might suggest an early sea ice melt along the Siberian coast this summer. Overall, the curve shown in Figure 4 is commensurate with the notion that a thinner arctic ice cover that is more mobile can lead to greater seasonal and interannual variability, with a potential loss in predictability.


Key statements from the individual Outlook contributions and PDFs of each contribution are below.
We should have a very interesting season this year, so stay tuned for next month's Outlook in July!
KEY STATEMENTS FROM INDIVIDUAL OUTLOOKS
Name (Organization of First Author); Estimate in Million Square Kilometers; Method
Ordered from Greatest to Least
Definitions of the different types of methods can be found in our Sea Ice Outlook glossary. PDFs of the individual contributions are at the bottom of this page.
Tivy (University of Alaska Fairbanks); 5.7 Million Square Kilometers; Statistical
This method is based on a simple regression where the predictor is the previous summer (May/June/July) sea surface temperature (SST) in the North Atlantic and North Pacific oceans near the marginal ice zone. Warmer than normal SST is associated with a reduction in ice extent; colder than normal SST is associated with an increase in ice extent.
Stroeve et al. (National Snow and Ice Data Center, NSIDC); 5.5 Million Square Kilometers; Statistical
Note: this value is an average of two estimates:
- 5.76 million square km based on the mean age- and latitude- corrected ice survival rates for 2000-2009
- 5.21 million square km based on the mean age- and latitude- corrected ice survival rates for 2005-2009.
We are using the same approach as last year: applying the survival fraction of ice of different ages determined from past seasons to the observed distribution of ice ages at the beginning of the melt season. It appears that a new record low will not be reached this year if the 2010 survival rates are within the range of historical ice survival rates. This is in part because there is more 2nd and 3rd year ice at the start of 2010 than has been seen the last few years. Also, winter extent was larger in 2010 than in previous years. If the 2010 survival rates are similar to 2007, however, the September 2010 extent will rival what was observed in 2007 (4.31 versus 4.13 million square km).
Pokrovsky (Main Geophysical Observatory, Russia); 5.5 Million Square Kilometers; Heuristic and Statistical
Future sea ice extent estimates in the Arctic might be obtained by joint analysis of time series of three climate indicators: AMO, PDO, AO for last thirty years. I used a modified regression analysis approach. This year is a cold one in this region (Pacific) due to the north wind domination. That explains that the sea ice extent in the Pacific sector of the Arctic exceeds climate (20th century) magnitudes. Now in the eastern part of the Barents Sea there is a significant area of the sea surface free of ice. The September sea ice extent anomaly should demonstrate tendencies of more ice in the Pacific and less ice in the Atlantic sectors. But, in general, the sea ice extent should attain a higher value than last year.
Kauker et al. (Alfred Wegener Institute for Polar and Marine Research); 5.4 Million Square Kilometers; Numerical Modeling
Note: this value is an average of two estimates:
- The Ensemble I mean value is 5.61 million km2 (bias included). The standard deviation of Ensemble I is 0.41 million km2 (2008: 0.55; 2009: 0.40).
- The Ensemble II mean of 5.19 million km2 is somewhat lower than the mean of Ensemble I (note that the optimization increases the predicted mean by about 0.07 million km2 compared to the uncorrected Ensemble I mean of 5.12 million km2). As for Ensemble I the standard deviation of Ensemble II is 0.41 million km2.
The ensemble prediction of September 2010 looks similar to the situation before 2007. A comparison of the modeled ice thickness on 1 June 2007, 2008, and 2009, and the initial ice thickness on 28 May 2010 reveals considerably larger ice thickness mainly in the East Siberian Sea, north of the East Siberian Sea, and in the vicinity of the North Pole in 2010 compared to 2007–2009.
Rigor et al. (Polar Science Center, University of Washington); 5.4 Million Square Kilometers; Heuristic
This estimate is based on the prior winter Arctic Oscillation (AO) conditions, and the spatial distribution of the sea ice of different ages as estimated from a Drift-age Model (DM), which combines buoy drift and retrievals of sea ice drift from satellites (Rigor and Wallace, 2004, updated). The DM model has been validated using independent estimates of ice type from QuikSCAT (e.g., Nghiem et al. 2007) and in situ observations of ice thickness from submarines, electromagnetic sensors, etc. (e.g., Haas et al. 2008; Rigor 2005).
Untersteiner and Morison (University of Washington); 5.3 Million Square Kilometers; Heuristic
Detailed outlook contribution not provided. (Authors: Norbert Untersteiner and James Morison, University of Washington).
Wellman (Princeton Consultants); 5.1 Million Square Kilometers; Statistical
The May melt has been the fastest in the satellite record. Arctic Oscillation has tended towards a state with lower than average ice export through Fram Strait, but that may be moderating.
Polar Science Weekend; 5.1 Million Square Kilometers; Heuristic
The Polar Science Weekend is an annual public outreach event organized by the Seattle Pacific Science Center and the University of Washington Polar Science Center. Members of the public were invited to make a prediction for this September's sea ice extent. We had a total of N = 60 guesses from about six hours of discussions. The mean was 5.1 million square kilometers and the standard deviation was 2.15 million sq km. The mean is quite near that predicted by the trend line (5.15 +/- 0.57 million sq km), but the spread is greater.
Wu and Grumbine (National Oceanographic and Atmospheric Administration, NOAA); 4.9 Million Square Kilometers; Statistical and Modeling
Note: this value is an average of two estimates:
- Model Prediction for September 2010 average ice extent: 5.13 million km2, standard deviation 0.25 million km2
- Statistical: 4.78 million km2, 0.45 million km2 sdev
Two approaches are used, statistical and modeling. The statistical approach continues from Grumbine in 2009. The approach is to consider the growth of open water as proceeding according to a population growth (positive feedback of more open water leading to more open water) with a constraint. The model prediction is based on the coupled Air-Sea-Ice Climate Forecast System (CFS) at NCEP. These predictions are based on the CFS Reanalysis and Reforecast model. An ensemble of 24 forecasts were made to provide estimates of mean and model variability. At this lead time, the model shows a consistent high bias in its forecasts of September ice extent. We have, therefore, attempted bias correction.
Arbetter et al. (North American Ice Service/National Ice Center); 4.9 Million Square Kilometers; Statistical/Heuristic
Despite the reasonably large current extent (14.665 million km2) and compact concentration (12.461 million km2) in late April, the projected extent for mid-September is another near-record low (4.852 million km2). The most compact ice is on the Canadian side of the Arctic Ocean, while the pack on the Siberian side is diffuse (1-3/10th concentration).
Gauthier et al. (Canadian Ice Service); 4.9 Million Square Kilometers; Heuristic/Empirical
The Canadian Ice Service (CIS) is predicting the minimum arctic sea ice extent to be less than 5 million square kilometres in September 2010. A value equal to or slightly greater than the average extent observed in September 2008 is expected. This value (4.7 ≤ x
| Attachment | Size |
|---|---|
| Combined Individual Outlook Contributions4.31 MB | 4.31 MB |
| Attachment | Size |
|---|---|
| Tivy48.54 KB | 48.54 KB |
| Stroeve et al.175.61 KB | 175.61 KB |
| Pokrovsky679.81 KB | 679.81 KB |
| Kauker et al.1.96 MB | 1.96 MB |
| Rigor et al.4.33 MB | 4.33 MB |
| Wellman51.94 KB | 51.94 KB |
| Polar Science Weekend1.84 MB | 1.84 MB |
| Wu and Grumbine38.49 KB | 38.49 KB |
| Arbetter et al.315.74 KB | 315.74 KB |
| Gauthier et al.176.73 KB | 176.73 KB |
| Zhang81.66 KB | 81.66 KB |
| Kaleschke and Spreen371.78 KB | 371.78 KB |
| Lindsay and Zhang283.14 KB | 283.14 KB |
| Maslanik2 MB | 2 MB |
| Wilson71.26 KB | 71.26 KB |
| Reference Article - Holland et al.687.4 KB | 687.4 KB |
| Attachment | Size |
|---|---|
| Gerland et al.339.08 KB | 339.08 KB |
| Gudmandsen268.81 KB | 268.81 KB |
| Howell and Agnew707.32 KB | 707.32 KB |
| Lindsay and Zhang709.16 KB | 709.16 KB |
| Maslanik212.78 KB | 212.78 KB |
| Petrich et al.260.45 KB | 260.45 KB |
| Pokrovsky679.81 KB | 679.81 KB |
| Tivy879.01 KB | 879.01 KB |
| Zhang95.53 KB | 95.53 KB |


