Highlights
The Sea Ice Outlook (SIO), a contribution to the Study of Environmental Arctic Change (SEARCH), provides an open forum for researchers and others to develop, share, and discuss seasonal Arctic sea ice predictions.
2017 Submissions: Once again we want to thank all our participants in the SIO! This year we received a total of 106 submissions for the pan-Arctic September extent, two more than we received in 2016. This was a new record number of contributions, with 33 received in June, 36 in July and 37 in August. We collected Alaska regional forecasts (the combined Chukchi, Bering and Beaufort seas) for the second year in a row and this year we included forecasts of the Antarctic maxima.
Observed and Predicted Extent: It is important to note that NSIDC changed their averaging method this year such that the monthly mean sea ice extent is now the average of all the daily sea ice extent values rather than the sea ice extent derived from the monthly average sea ice concentration. As a result, sea ice extents are slightly lower than before (i.e. 2016 extent previously was 4.70 and now is 4.51 million square kilometers). This year, the observed mean extent for the month of September was 4.80 million square kilometers with the new averaging method compared to 4.87 million square kilometers using the old method. This represents a September sea ice extent that was 1.6 million square kilometers below the average September extent for 1981–2010, but 1.23 million square kilometers above the record low in September 2012 and 300,000 square kilometers above that in 2016. The median Outlook across all methods was 4.43 million square kilometers in June, 4.50 million square kilometers in July and August. Across all methods, the interquartile range in July and August just included the observations with the new averaging (4.2 to 4.8 million square kilometers), but it fell short in June (with an upper value at 4.71 million square kilometers). With the older averaging method, all forecasts interquartile ranges would have fallen outside the observed value.
Methods: This year we received a total of 44 statistical forecasts, 43 dynamical, 10 heuristic, and 9 using mixed methods. Compared to other methods this year, the median and interquartile range of the Outlooks from statistical models better matched the observations than any other methods, including those based on dynamic models (i.e. coupled ice-ocean and ice-ocean-atmosphere models). This year's report contains significant discussion on the different Outlook prediction methods used.
Weather Patterns: The sea ice conditions this season were exceptional, with record low winter and spring sea ice extents through April. Warm weather conditions and thinner sea ice led to early formation of open water in the Chukchi Sea, the lowest observed in May. However, air temperatures in June through August were near or below the 1981 to 2010 average over much of the Arctic Ocean, especially on the Siberian side which helped to slow overall ice loss and keep the ice edge near the climatological mean in the Barents and Kara seas.
Introduction
The Sea Ice Outlook (SIO) Post-Season Reports are a synthesis of the Arctic conditions that occurred during the recent forecast "season", namely the state of the Arctic in May and the evolution of the sea ice and climate through September. The Sea Ice Prediction Network (SIPN) is a community of scientists and stakeholders with the goal of advancing understanding of the state and evolution of Arctic sea ice, with a focus on communicating forecasts of the Arctic summer sea ice fields and the pan-Arctic September extent. Members of SIPN contribute to the SIO, and a SIPN project leadership team manages the Network, the SIO, and informational resources and activities to improve forecasts.
We thank the participants who contributed to the 2017 SIO. This year we received a total of 106 submissions of pan-Arctic September extent forecasts, with 33 in June, 36 in July, and 37 in August. Nine of the teams who submitted pan-Arctic forecasts also submitted full spatial fields of sea ice probability and three submitted full spatial fields of ice-free dates. This year we again collected forecasts of the extent in the combined Chukchi, Bering, and Beaufort seas, which we are calling the "Alaskan Region" and for the first time we collected forecasts for the Antarctic maximum extent, receiving 7 in June, 12 in July and August. We discuss these Outlooks, and compare them to each other and the observations this year.
This year continued what was already an exceptional year in 2016.
Review of Arctic 2017 Conditions
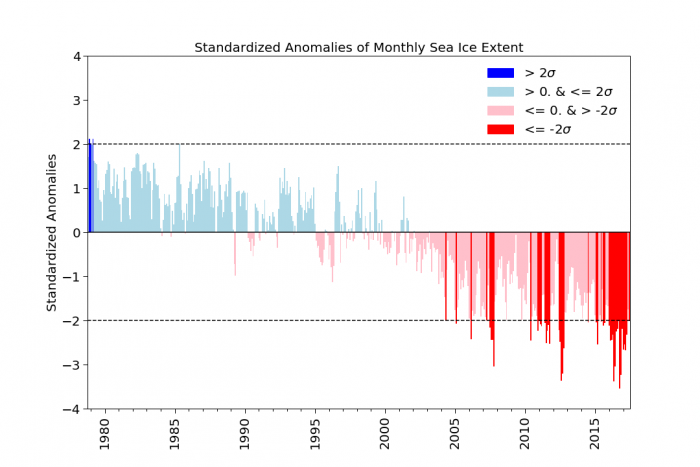
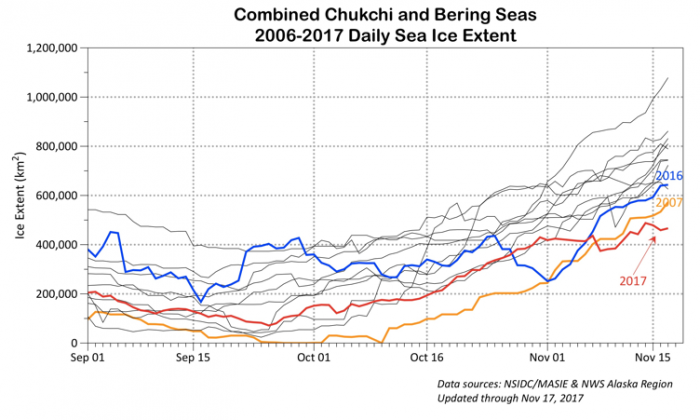
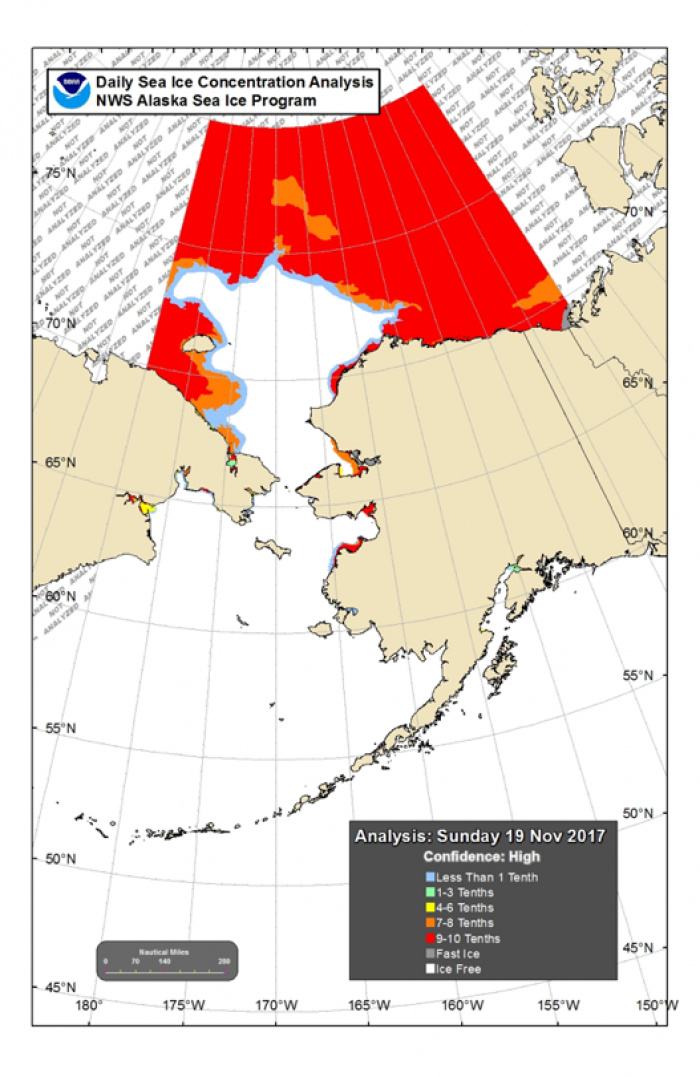
This winter and spring saw a continuation of record low sea ice extents until April, when the sea ice extent tied with that in 2016. This represented 16 consecutive months with the sea ice extent falling more than 2 standard deviations (2σ) below the 1981-2010 long-term mean (Figure 1). At no other time in the satellite data record has there been this many months in a row with sea ice extent more than 2σ from the mean. While things slowed down in May, the sea ice extent remained below 2σ also in June, July and August, and again in October. During October and November of 2017, anomalously low sea ice conditions were observed throughout the Arctic. However, conditions this autumn have been most anomalous in the Chukchi Sea, where significant amounts of open water remained in November, leading to the lowest sea ice extent within the combined Bering and Chukchi seas at this time of year (Figure 2).
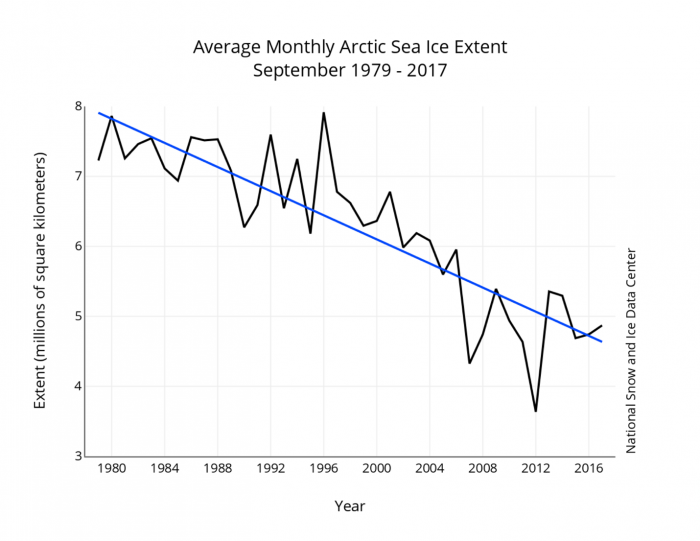
An interesting thing to note for this year, as well as last year is that the observed September sea ice extent fell close the long-term trend line (Figure 3). Extrapolation of the linear trend would have given a forecast of 4.53 million square kilometers, or 264,000 square kilometers below the observed value. Previous studies have reported that the SIO forecasts perform well when the observed extent falls close to the long-term trend line. This year the median extent in July and August was 300,000 million square kilometers below the observed value, a similar bias as extrapolation of the long-term trend would have provided.
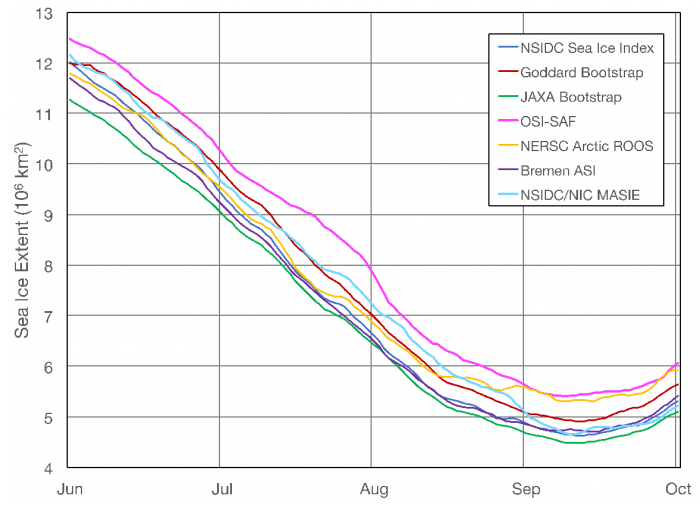
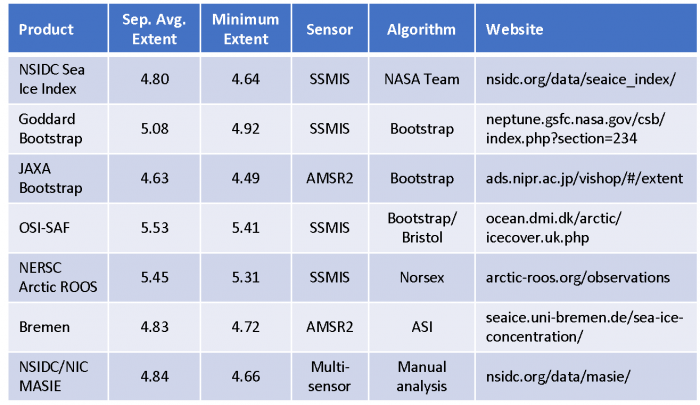
Besides the change in averaging, which does have an impact on how well the SIO performed this year, there are several other sea ice algorithms available. NSIDC bases their near-real-time sea ice concentration and extent data record on the NASA Team algorithm. However, there are a range of estimates of observed extent from other algorithms using data from either passive microwave sensors (either SSMIS or AMRS2), or in the case of the Multisensor Analyzed Sea Ice Extent (SIE) product from a manual analysis employing several different types of sensors (Figure 4). Some SIO contributors assimilate sea ice concentrations derived from different sea ice algorithms, which will likely influence how well the methods compare with NSIDC's value. The SIO 2015 Post-Season Report previously explained why these algorithms yield different estimates, based on different sensitivities to emissivity variations, different spatial resolutions (i.e. AMSR2 vs SSMIS) and different land masks, resolution. The range of estimates from these algorithms in Figure 4 provides an indication of uncertainty in the observed extent. 3 of the 7 estimates for the monthly mean September extent are above 5 million square kilometers, and 4 are below. The ones below 5 million square kilometers are all within 0.21 square kilometers of each other (4.63 to 4.84), whereas the ones above 5 million square kilometers range from 5.08 to 5.53 million square kilometers, with OSI-SAF showing the largest mean September extent and JAXA Bootstrap the lowest, representing a 0.9 million square kilometers difference.
The Melt Season in Review
Winter 2017 was even warmer than that in 2016, leading to the least number of freezing degree days recorded during the satellite data record (see June outlook report). This led to the lowest maximum extent recorded in March. Winter thickness estimates from CryoSat-2 suggested generally thinner ice throughout most of the western Arctic but thicker ice within the eastern Arctic (Figure 5).

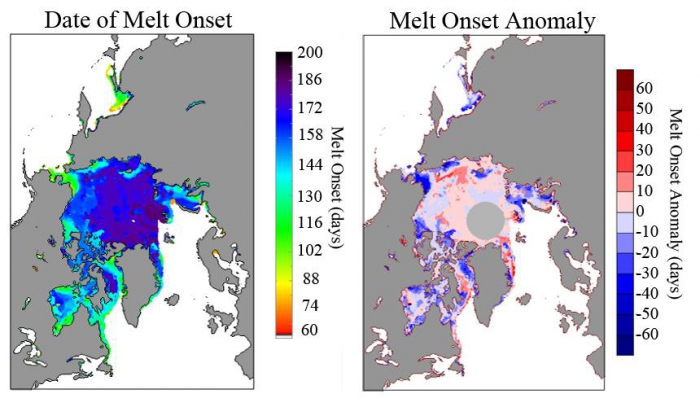
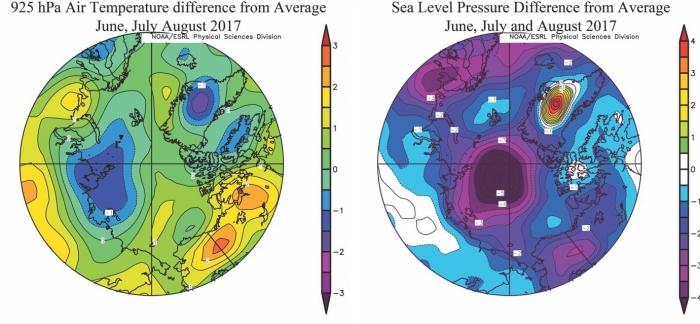
However, despite record low maximum extent, Arctic-wide the melt onset was relatively slow this summer. Melt onset was near average or slightly later than the 1981-2010 mean throughout most of the central Arctic. The only locations where melt onset was earlier than average occurred within the Chukchi, southern Beaufort, Kara Sea, Hudson Bay and Northern Baffin Bay (Figure 6), and may in part explain earlier development of open water in the Chukchi Sea and the southern Beaufort Sea this summer. Strong winds from the north also occurred for a few days at the end of March and early April, pushing ice southward in the Bering Sea, breaking up the ice in the Chukchi Sea and also flushing some ice out through Bering Strait. Elsewhere, later melt onset was observed, resulting in later development of melt ponds. Late melt onset over much of the central Arctic is in agreement with mostly cooler summer air temperatures. Air temperatures at the 925 hPa level averaged from June through August that were near or below the 1981-2010 average over much of the Arctic Ocean (Figure 7a). This was particularly true on the Siberian side centered over the Laptev Sea, where summer (JJA) air temperatures were 1 degree Celsius below the 1981-2010 average. The only part of the Arctic this summer that was slightly warmer than average was over much of the East Siberian, Chukchi and Beaufort Seas (1 Celsius above average).
The air temperature pattern reflects a persistently stormy summer over the central Arctic Ocean, with JJA sea level pressure showing low pressure south of the North Pole in the Siberian Arctic (Figure 7b). Low pressure systems are typically "cold cored", helping to explain the cooler summer temperatures in this part of the Arctic.
Review of 2017 Sea Ice Outlooks
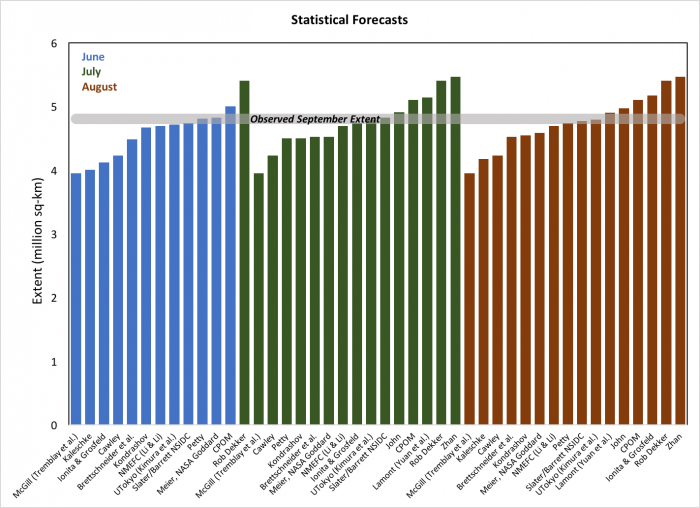
The Outlooks of pan-Arctic sea ice extent submitted in 2017 are summarized in Figure 8 with the observed ice extent of 4.80 million square kilometers taken from the updated NSIDC sea ice index. The median Outlook across all methods was 4.43 million square kilometers in June and 4.50 million square kilometers in July and August. This year, only the statistical methods had interquartile ranges that included the observations. In addition, the median extent from statistical methods compared well with the observed extent.
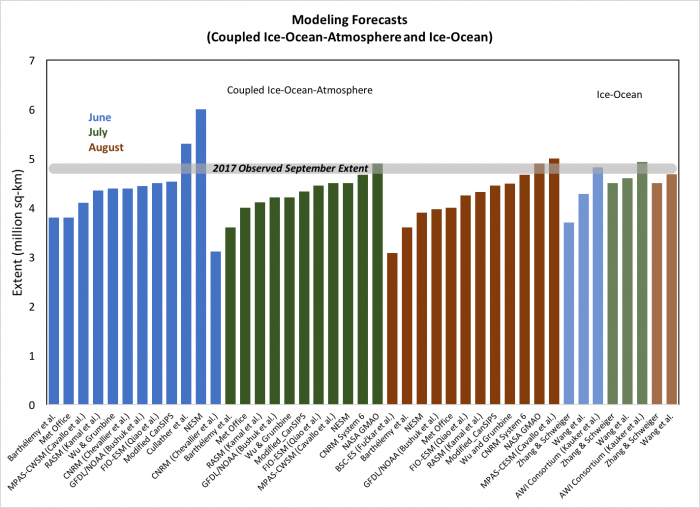
The median and interquartile range of the Outlooks from dynamical models (ice-ocean and ice-ocean-atmosphere) performed worse this year than last year when they provided a better match with the observations. Usually improvements in the forecast error (or bias) and range are expected if the forecast period, known as "lead-time", shortens and information from June and July can be incorporated in later forecasts. There is some evidence this is the case in Figure 8, as the interquartile range from the dynamical models approached the observed extent, however the median did not become progressively less biased. Interestingly the extreme forecasts from the dynamical models increased over time. For statistical forecasts, the median did become less biased as the summer progressed.
Earlier we discussed the fact that the range of observational estimates of the September sea ice extent can be quite large, from 4.63 to 5.53, or 0.9 million square kilometers. In 2016 and 2015 the range was smaller (~0.4 million square kilometers). The NSIDC sea ice index was near the bottom of the range, so the forecast error of the median Outlook would be higher if we chose a different observational estimate of the September sea ice extent for verification this year. Only with the observational value from JAXA would the forecast error be within 0.13 million square kilometers. While the NSIDC sea ice index is the official estimate used for the SIO, different groups may be using a different sea ice concentration estimates in their forecast initialization. The impact of this is unclear however, as the participants of the Outlook may have developed their forecast system to target the NSIDC sea ice index. It is also unclear how the change in averaging by NSIDC would impact the targets made by the contributors.
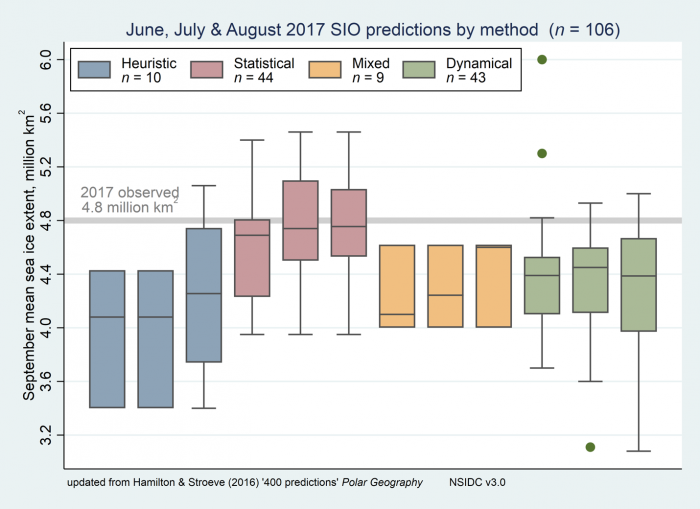
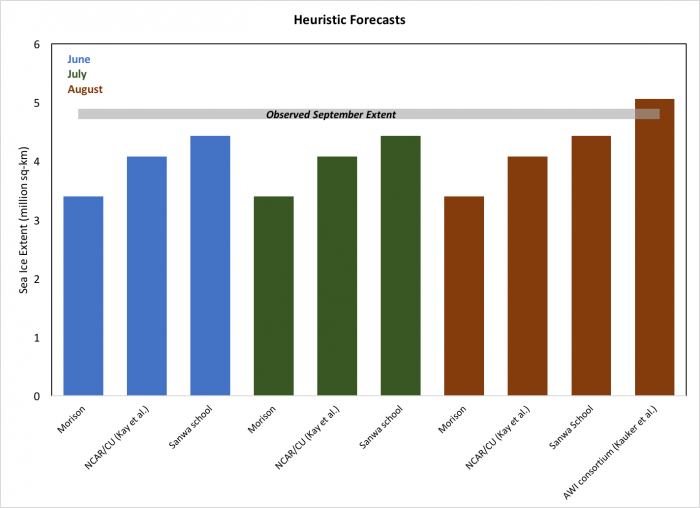
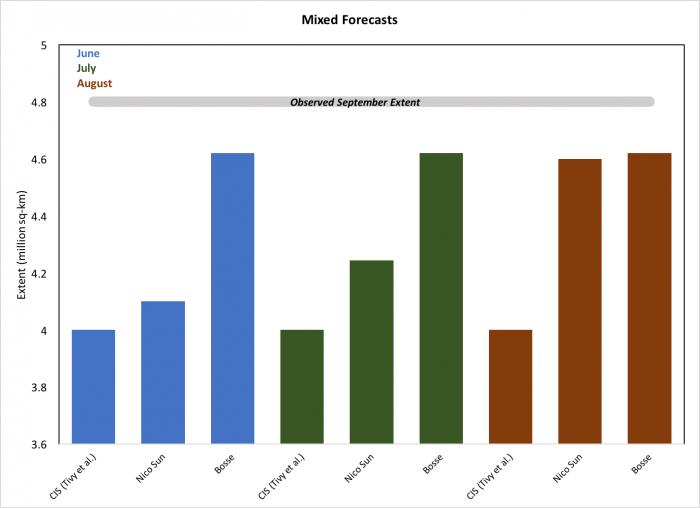
Figures 9a, 9b, 9c, and 9d show individual pan-Arctic contributions to the 2017 SIO June, July, and August Reports separated by type of method used to develop the forecasts: heuristic (Figure 9a), dynamical models (Figure 9b), statistical (Figure 9c), and mixed methods (Figure 9d).
This year we once again requested participants optionally submit an estimate of the sea ice extent for the Alaskan region, defined here as the combination of the Bering, Chukchi, and Beaufort seas. We asked contributors to take the boundaries for these seas from the NSIDC Arctic sea ice regional graph.
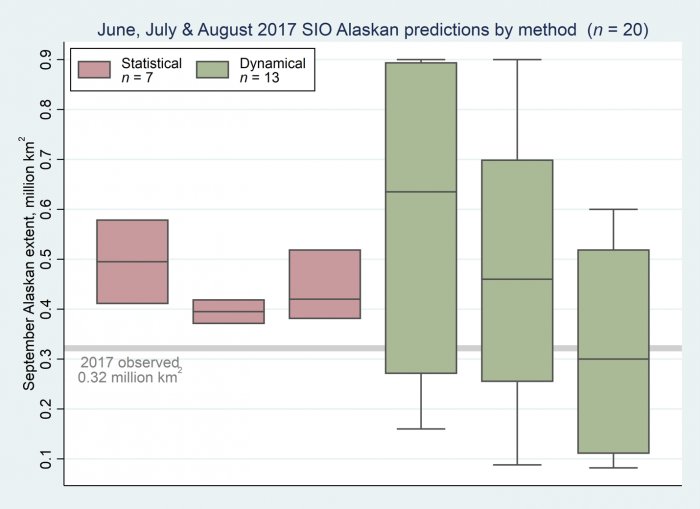
We received six Outlooks of the Alaskan regional sea ice extent in June and July and eight in August, shown in Figure 10. The observed 2017 extent in the Alaskan region (using the near real-time NASA Team algorithm) was 0.32 million square kilometers. This was slightly higher than in 2016 (0.27 million square kilometers). Sea ice extent in the Beaufort Sea was the 3rd lowest in the satellite record this summer compared to second lowest in 2016, though sea ice extent was less this summer in the Bering and Chukchi seas. The median Outlooks were all biased high relative to the observed value, though they came closer as the season progressed. The August Outlook from the Navy Earth System Model best matched the observed sea ice extent.
Review of Statistical Methods
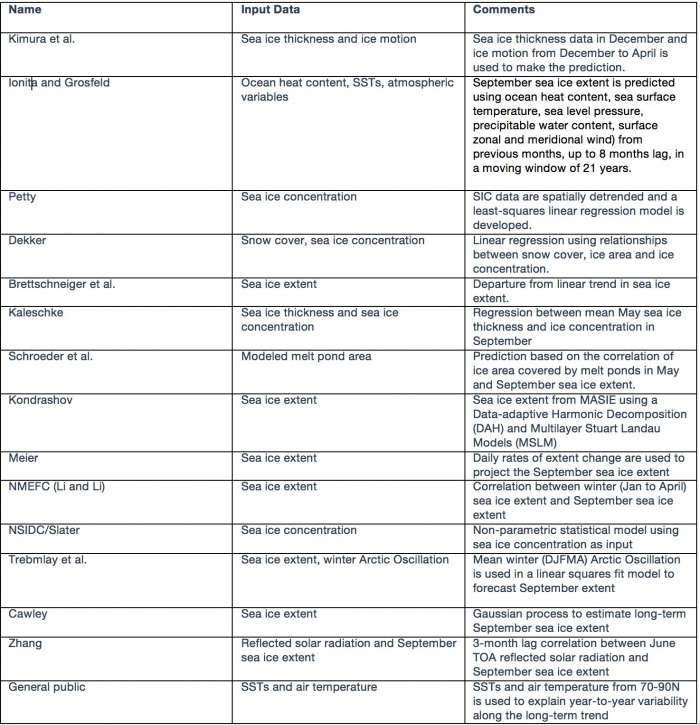
A variety of statistical methods are used by SIO participants. The table below is a summary of the methods used in 2017. Many of the statistical forecasts use sea ice extent or concentration as a predictor, sometimes alone, and sometimes with atmospheric and/or oceanic variables and/or ice thickness. One forecast also included ice motion, and another one used the winter Arctic Oscillation (which provides an indirect measure of winter ice motion). Another included snow cover on land as a predictor. Even if groups use similar data as input, there is a great diversity in the statistical approaches used, including multiple linear regression with previous months to simple persistence of anomalies from mid-summer to more complex stochastic methods. Most participants take into account the trend in their method.
As we found last year, there is no evidence that the forecast error depends on any broad classification of the statistical methods. Thus, it is not possible to conclude that there is a benefit from using any particular set of variables as predictors. Such an assessment might be possible as we collect data in future years.
Local-scale analysis
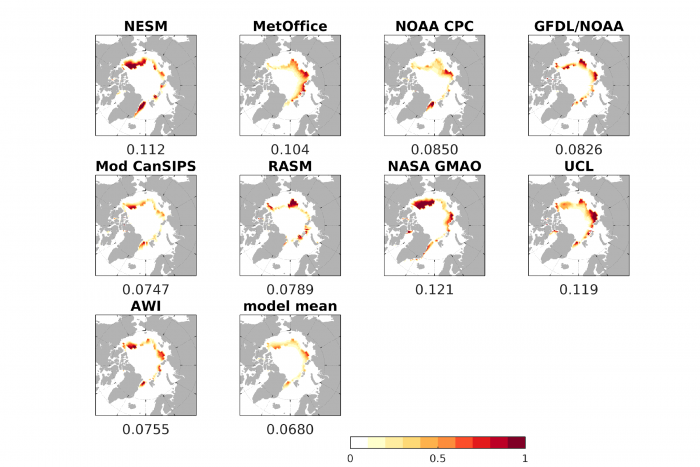
As we have done since 2014, teams were invited to submit forecasts of sea-ice extent probability (SIP – forecast probability of SIC larger than 15%). This year we received a record number of SIP forecasts: 9 in June, 11 in July, and 6 in August. Figure 11 shows the SIP June Forecast, with the observed September sea-ice extent edge overlain, together with the ensemble mean of individual models' SIP, and the model uncertainty in the SIP forecast (as represented by the standard deviation across SIP forecasts).
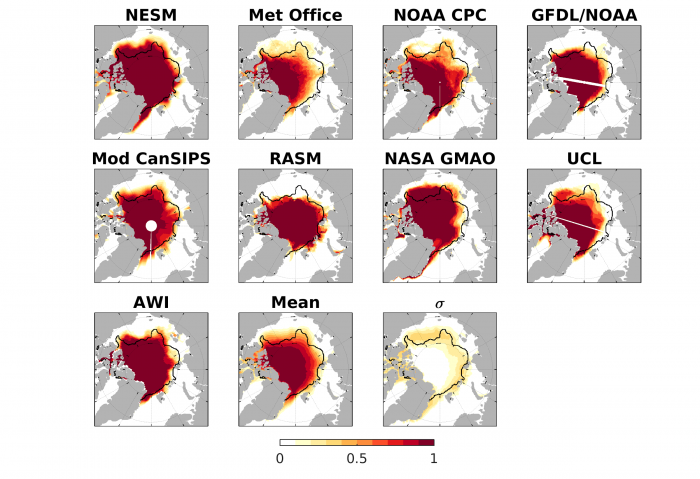
Overall, in 2017 models were more successful and consistent in their SIP forecasts along the 'European' Arctic (Svalbard, Barents/Kara seas), and less so in the East Siberian/Beaufort seas. Interestingly, the observed sea ice edge lies almost entirely within the region of model uncertainty (bottom right panel), a positive result which indicates that overall the models are not consistently over-or-under predicting sea ice conditions.
To quantify the skill of SIP forecasts, in Figure 12 we show the Brier scores (a metric constructed so that 0 indicates a perfect forecast and 1 indicates an erroneous, or zero skill, forecast) from each SIP forecast and the multi-model mean. The value on the x-labels shows the pan-Arctic, spatially averaged Brier score (lower values indicate more accurate forecasts).
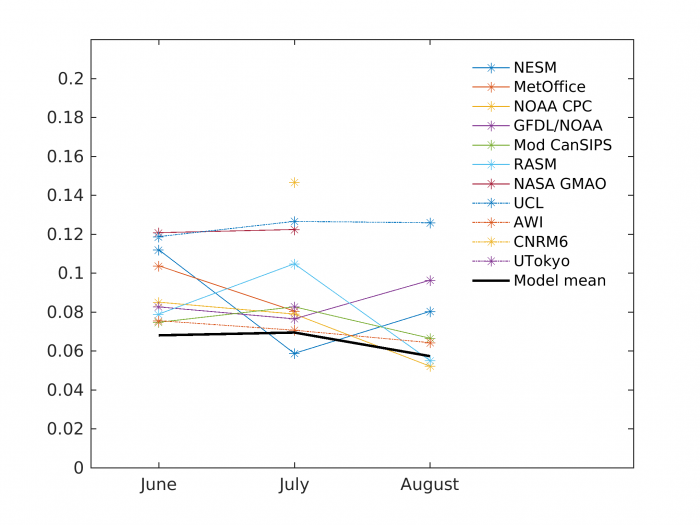
How did SIP forecast accuracy evolve from the June to the August outlooks? Figure 13 shows the spatial mean Brier scores for all models' submissions and that of the model mean SIP from June to August. Several interesting features arise. One, we see that there is generally little change from June to August, and the spread in Brier scores does not decrease. Secondly, the multi-model SIP forecast tends to be the best or among the best forecast. This has also been found in previous years.
Antarctic contributions
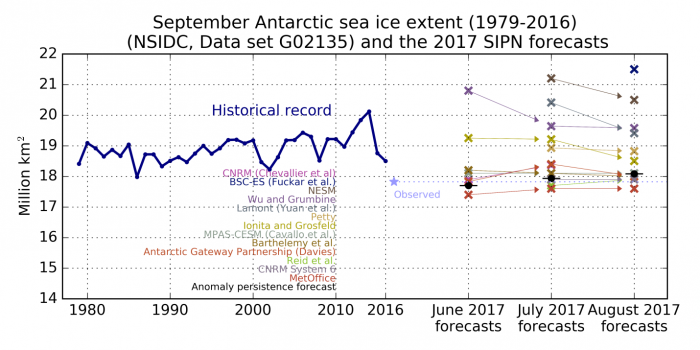
This year we received Antarctic submissions from 13 different groups. These groups are contributors to the Arctic Sea Ice Outlook and we thank them for making the effort to also produce Antarctic forecasts.
For all three forecast exercises (June, July, August) the spread remained large, exceeding by far the range of the historical record. Notably, the predictions did not become more confident over time, as it has sometimes been noted for the Arctic. This year saw a record-low sea ice extent in September (17.83 million km² according to the NSIDC/NOAA G02135 product).
It is impossible to diagnose the origins of forecast spread and for several reasons. First, only the total (circumpolar) monthly mean Antarctic sea ice extent was requested, hence we cannot pinpoint the regions contributing to the total error. Second, groups did not submit details about their forecast methodologies and in particular on the application of bias correction or not. To approach this question in a more systematic way, a dedicated coordinated experiment is scheduled for February 2018 (details for submission) in the framework of the SIPN South project.
Sea Ice Drift Forecast Experiment
This year marks the beginning of the Sea Ice Drift Forecast Experiment (SIDFEx), a contribution to the Year of Polar Prediction (YOPP). SIDFEx is a community effort to collect and analyze Arctic sea ice drift forecasts at lead times from days to a year, based on arbitrary methods, for a number of sea-ice buoys and, ultimately, for the MOSAiC Drift, on a regular basis.
So far, six groups have contributed drift forecasts to SIDFEx. Three of these (nrl001=NESM, awi003=AWI, ucl001=UCL) have derived their forecasts by means of diagnostic tracking based on SIO model (coupled and uncoupled) prediction drift fields. Another group (uw001) has followed a similar model approach, whereas one group (awi001) has based the forecasts on satellite-derived drift fields of past years which may serve as a proxy for a climatological reference forecast. All these groups have submitted ensembles of drift trajectories. In addition, one group (metno001) submits daily short-term (10-day) deterministic forecasts in near-real-time, which will be discussed elsewhere. We are very grateful to all these groups for their contributions.
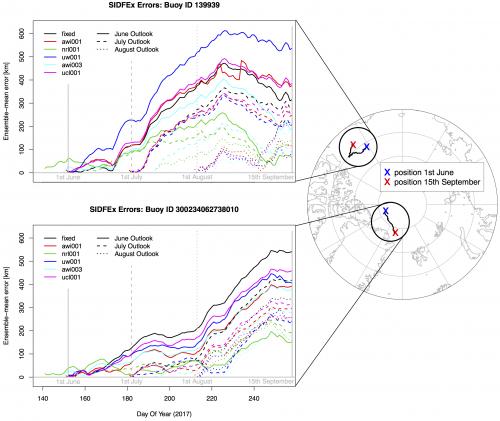
Figure 15 shows the ensemble-mean error evolution of forecasts corresponding to the June, July, and August SIO for two of the targeted IABP buoys. Given that these are just two single observed trajectories, no robust conclusions can be drawn. Apart from the June Outlook for buoy 139939, all forecasts are largely at least better than a stationary reference (black curves; position “fixed” on the first of June (solid), July (dashed), and August (dotted), respectively), whereas the satellite-based climatological forecasts (awi001, red curves) are more difficult to beat. A striking feature is the temporal coherency of the errors on synoptic timescales, caused by corresponding variations of the observed buoy positions; the forecast trajectories are much smoother due to the ensemble-averaging (not shown). We hope that even more SIO groups and others will contribute to SIDFEx in 2018 and 2019 to allow broader analyses. If you are interested, please contact sidfex [at] polarprediction.net .
Report Credits
This post-season report was developed by the SIPN Leadership Team, and with input provided to an earlier draft of the post-season report via circulation on the SIPN mailing list.
Report Lead
Julienne Stroeve; University College London and National Snow and Ice Data Center.
Additional Contributors:
Helge Goessling; Alfred Wegener Institute, Division of Climate Sciences and Climate Dynamics.
François Massonnet; Université catholique de Louvain (UCL), Brussels and Catalan Institute of Climate Sciences (IC3, Barcelona, Spain).


