Outlook Report
Executive Summary
The 2018 Arctic summer melt season has come to a close. The September monthly averaged sea ice extent was 4.71 million square kilometers, based on the National Snow and Ice Data Center (NSIDC) Sea Ice Index. This ranks as effectively tied with 2008 for the 6th lowest in the satellite record that began in 1979. The median extent of the 39 Outlook contributions for June, July, and August were 4.60, 4.70, and 4.57 million square kilometers, respectively. Overall, the Outlooks performed well, with the observed extent falling within the interquartile range of the projections for each month. This interim report is intended as a quick post-season update that summarizes how the outlooks did in comparison to the observed minimum extent. A full post-season report in January 2019 will include an in-depth analysis of factors impacting sea ice this season; further discussion about the outlooks; comments on regional observations, predicted spatial fields, Antarctic contributions, and a summary from the Sea Ice Drift Forecast Experiment.
This Interim Post-Season Sea Ice Outlook Report was developed by lead author Walt Meier, National Snow and Ice Data Center (Overview and discussion of current conditions); Edward Blanchard-Wrigglesworth, U. Washington and Nic Wayland, U. Washington (Discussion on predicted spatial fields); Uma Bhatt, U. Alaska Fairbanks, Geophysical Institute; John Walsh, International Arctic Research Center; and Rick Thoman, National Weather Service, Alaska Region (Discussion of current conditions); Bruce Wallin, NSIDC (statistics and graphs); Betsy Turner-Bogren, Helen Wiggins, and Stacey Stoudt, ARCUS (report coordination and editing); and the rest of the SIPN2 Leadership Team.
Overview
Based on the National Snow and Ice Data Center (NSIDC) Sea Ice Index (SII, Fetterer et al., 2017), sea ice extent averaged for September 2018 was 4.71 million square kilometers, tied with 2008 for the 6th lowest in the satellite record that began in 1979. The September trend through 2018 is -82,300 square kilometers per year (12.8 % per decade, relative to the 1981-2010 average) (Figure 1). The annual minimum extent (based on a 5-day running average) was 4.59 million square kilometers according to the SII; also tied for the 6th lowest but with both 2008 and 2010. The minimum extent was reached twice, on September 19 and 23, which was later than the median minimum date of September 14. September 23 tied with 1997 for the latest minimum in the satellite record.

The medians of the Outlook contributions for June (Figure 2), July, and August were 4.60, 4.70, and 4.57 million square kilometers, respectively. Thus, the July ensemble Outlook was nearly perfect in terms of total extent. The August median projection was lower than the observed September extent; this was likely due to an above average rate of ice loss during July, which caused contributors to revise their projections downward. However, as discussed further below, the August rate of decline was near average, causing the observed September extent to diverge from the August projection. Regardless, the inter-quartile range of the projections of 4.4 to 4.9 million square kilometers bracketed the observed September extent. This fits a pattern noted before: Outlooks perform well when the observed extent is near the trend line as it is this year (Figure 2.1) (Stroeve et al., 2014). Outlier years are more difficult to predict and the performance of Outlooks in such years has generally been less skillful.

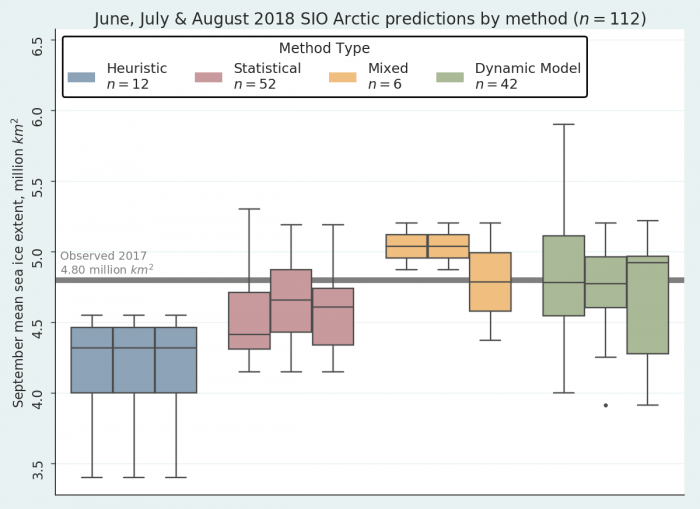
In comparing the different methods, dynamic models performed best overall, with the observed extent within the model inter-quartile range from all three Outlooks (June, July, August), though the June and July medians were closer to the observed extent than the August median (Figure 3). Outlooks from statistical methods were generally too low, although the median of July contributions was very close to observations and their inter-quartile range bracketed the observed extent. Mixed and heuristics methods had a limited number of contributions, making assessments more difficult; in general, mixed methods projected higher September ice extent than observed, while heuristic methods projected lower ice extent.

Comment On Predictions Of Sea Ice Probability (SIP)
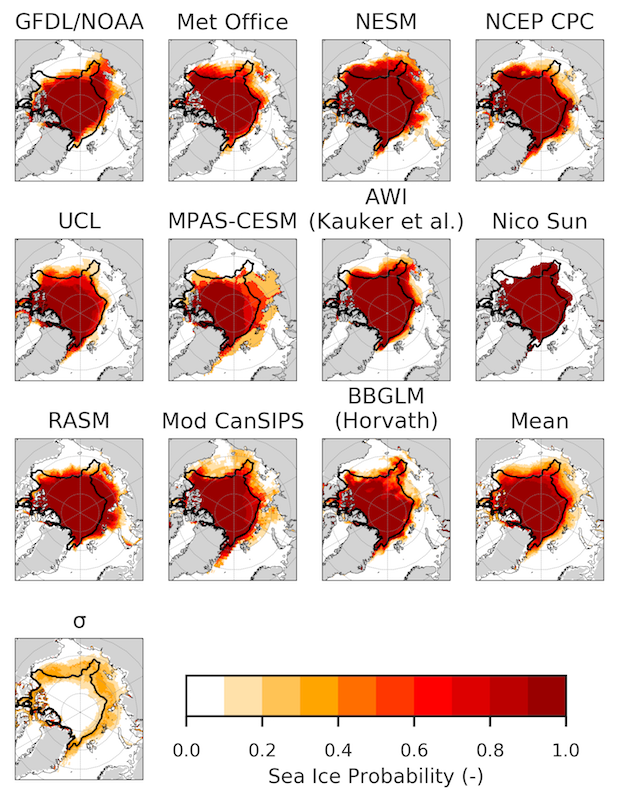
As has been done since 2014, teams were invited to submit forecasts of sea-ice extent probability (SIP – forecast probability of sea ice concentrations larger than 15%). This year a record number of SIP forecasts were received: 10 in June, 14 in July, and 12 in August. Figure 4 shows the SIP June Forecast, with the observed September sea-ice extent edge overlain, together with the ensemble mean of individual models' SIP, and the model uncertainty in the SIP forecast (as represented by the standard deviation across SIP forecasts).

Overall, models were more successful and consistent in their SIP forecasts along the 'European' Arctic (Svalbard, Barents/Kara seas), and less so in the East Siberian/Beaufort seas. Interestingly, the observed sea ice edge lies almost entirely within the region of model uncertainty (bottom left panel), a positive result which indicates that the models are not consistently over-or-under predicting sea ice conditions.
Summer Conditions

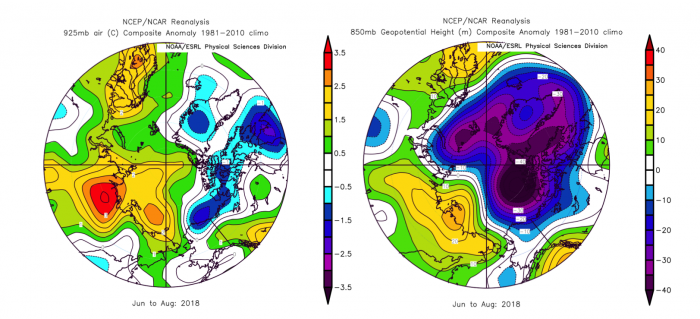
Summer (June-August) 925-hPa air temperatures were above average over the Arctic Ocean and Eurasia and were below average over coastal North America (Figure 5, left panel). The 850-hPa geopotential height (Figure 5, right panel) was anomalously low over the central Arctic Ocean, North America and the Atlantic sector of the Arctic. Heights were above average over much of northern Eurasia. Seasonal anomalies for sea level pressure (SLP) are similar to those of 850-hPa geopotential height. The June-August SLP pattern in 2016 and 2017 anomalously low pressure was centered over the Arctic Ocean whereas in 2018 there were dual low pressure centers, one in the Barents Sea and one closer to the Canadian Arctic. Seasonal 925-hPa temperature averaged from 70-90N over the 1979-2018 period shows an increase in temperature starting in 1997 peaking around 2007 and declining until 2018. Temperatures in 2018 rank as the 6th warmest over the 1979-2018 period. Seasonal SLP for 2018 ranked at the 3rd lowest pressure and was lower than the past two years. One interesting feature of the summer was the variability between months. July was a cool month, while June and particularly August were warm. In fact, August 925 mb temperatures were actually higher than July, something not seen in the past 40 years (Figure 6). Despite the summer variability and the warm August, given that the atmospheric seasonal temperatures were overall warm but not extreme, they are broadly consistent with the ranking of sixth lowest sea ice minimum in 2018.

References
Fetterer, F., K. Knowles, W. Meier, M. Savoie, and A. K. Windnagel. 2017, updated daily. Sea Ice Index, Version 3. Boulder, Colorado USA. NSIDC: National Snow and Ice Data Center. doi: https://doi.org/10.7265/N5K072F8.
Stroeve, J., L. C. Hamilton, C. M. Bitz, and E. Blanchard-Wrigglesworth (2014), Predicting September sea ice: Ensemble skill of the SEARCH Sea Ice Outlook 2008–2013, Geophys. Res. Lett., 41, doi:10.1002/2014GL059388.
Report Credits
This 2018 Sea Ice Outlook Interim Post-Season Report was developed by the SIPN2 Leadership Team
Report Lead:
Walt Meier, National Snow and Ice Data Center
Additional Contributors:
Uma Bhatt, University of Alaska, Geophysical Institute
Rick Thoman, National Weather Service, Alaska Region
John Walsh, International Arctic Research Center
Edward Blanchard-Wrigglesworth, University of Washington, Department of Atmospheric Sciences
Nicholas Wayand, University of Washington, Department of Atmospheric Sciences
Bruce Wallin, University of Colorado, Boulder, NSIDC
Editors:
Betsy Turner-Bogren, ARCUS
Helen Wiggins, ARCUS
Stacey Stoudt, ARCUS
Suggested Citation:
Meier, W., U. S. Bhatt, J. Walsh, E. Blanchard-Wrigglesworth, N. Wayand, R. Thoman, F. Massonnet, J. Zhang, W, M. Serreze, J. Stroeve, L. C. Hamilton, C. M. Bitz, J. E. Overland, H. Eicken, H. V. Wiggins, M. Wang, P. Bieniek, J. Little, J. Kurths, M. Steele, E. Hunke, T. Jung, and B. Wallin. Editors: Turner-Bogren, B., H. V. Wiggins and S. Stoudt. October 2018. "2018 Sea Ice Outlook Interim Post-Season Report."
Published online at: https://www.arcus.org/sipn/sea-ice-outlook/2018/InterimPostSeason


