Outlook Report
Executive Summary
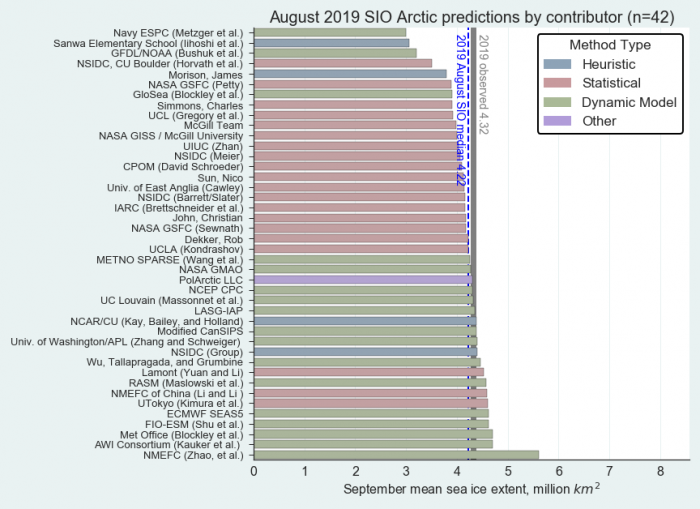
The Arctic has reached the end of the 2019 summer melt season. The September monthly averaged sea ice extent was 4.32 million square kilometers, based on the National Snow and Ice Data Center (NSIDC) Sea Ice Index (SII). This is the third lowest in the satellite record that began in 1979. The median extent of the Outlook contributions for June (31 contributions), July (39 contributions), and August (42 contributions) were 4.40, 4.28, and 4.22 million square kilometers, respectively. Overall, the Outlooks performed well throughout the summer, with the July average having the lowest mean difference from observations of only 0.04 million square kilometers. The observed September extent was encompassed by the interquartile range of the Outlooks from each of the three months.
This interim report is intended as a quick postseason update that summarizes how the outlooks did in comparison to the observed September monthly mean extent. A full post-season report to be published in February 2020 will include an in-depth analysis of factors impacting sea ice this past summer, further discussion about the outlooks, comments on regional observation, predicted spatial fields, Antarctic contributions, and a summary from the Sea Ice Drift Forecast Experiment (SIDFEx).
This Interim Post-Season Sea Ice Outlook Report was developed by lead author Walt Meier, NSIDC (Overview and discussion of current conditions); Uma Bhatt, University of Alaska Fairbanks, Geophysical Institute; John Walsh, International Arctic Research Center; and Rick Thoman, Alaska Center for Climate Assessment and Policy, International Arctic Research Center, University of Alaska (Discussion of current conditions); Molly Hardman, NSIDC (Statistics and graphs); Betsy Turner-Bogren, Helen Wiggins, Lisa Sheffield Guy, and Kuba Grzeda, ARCUS (report coordination and editing); and the rest of the SIPN2 Leadership Team.
Overview
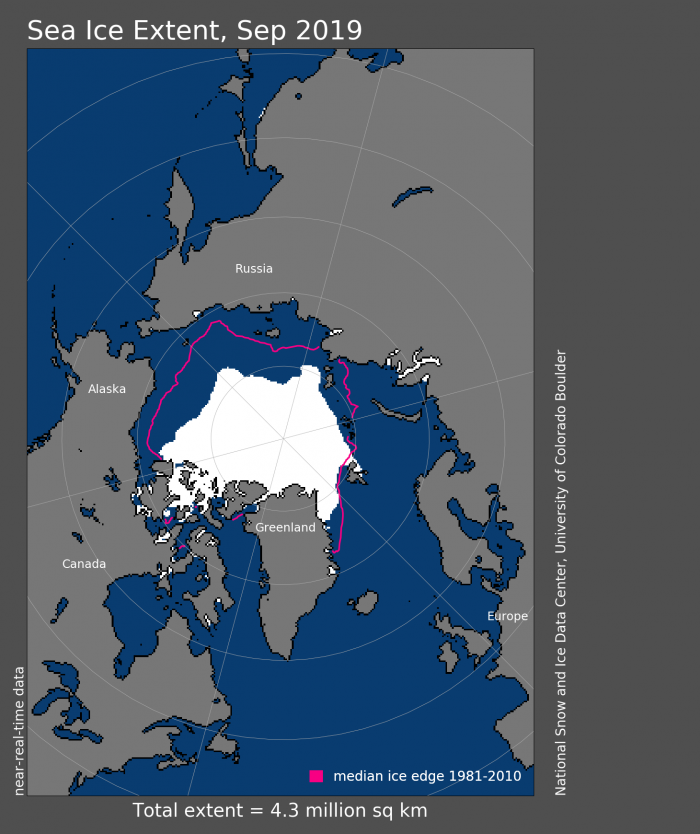
Based on the NSIDC Sea Ice Index (SII, Fetterer et al., 2017), the 2019 September average sea ice extent was 4.32 million square kilometers, third lowest in the satellite record that began in 1979: it was 49,000 square kilometers above the 2007 record and 750,000 square kilometers above the record low in 2012. The trend of September average sea ice extent through 2019 is -82,400 square kilometers per year, or -12.9 % per decade, relative to the 1981–2010 average. (Figure 1). Another measure of sea ice extent is the annual daily minimum extent: the day the extent reaches its lowest value, based on a 5-day running average. This year, the daily minimum extent was 4.15 million square kilometers and occurred on 18 September, according to the SII; this tied with 2007 and 2016 for the second lowest minimum in the satellite data record, above the lowest minimum in 2012. The 18 September minimum date was four days later than the 1981-2010 median date. The 2019 September sea ice extent fell just below the long-term linear trend line. As can be seen in Figure 2, the median Arctic sea ice edge for 15 September was up to several hundred kilometers poleward from the historical (1981–2010) median ice edge location.
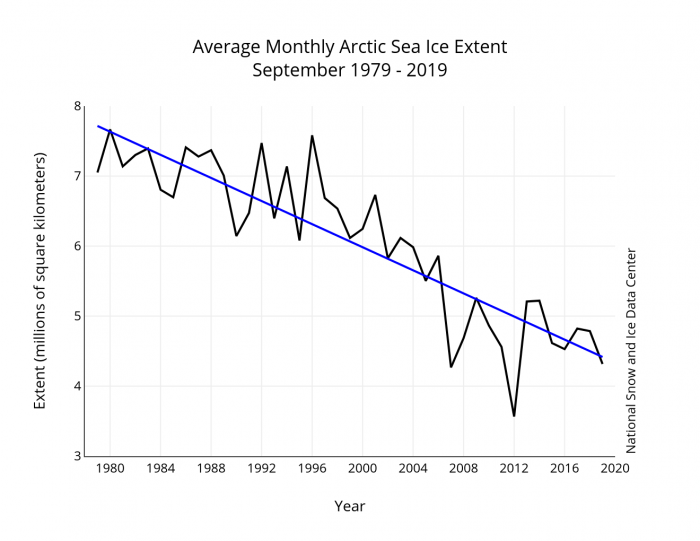
The medians of the Outlook contributions for June, July, and August were 4.40, 4.28, and 4.22 million square kilometers, respectively, with the July SIO coming closest to the observed September extent. Forecasts made in August were for slightly lower ice conditions (Figure 3), which likely reflects the fast pace of ice loss observed in July. However, after the beginning of August, the rate of ice loss slowed significantly in response to changing atmospheric circulation, and the August Outlook forecasts underestimated the September extent. Regardless, the interquartile range of the projections from June (4.2 to 4.8 million square kilometers), July (4.0 to 4.6 million square kilometers), and August (4.0 to 4.4 million square kilometers) bracketed the observed September extent. While the August median was less accurate than in July, the interquartile range was narrower and thus provided a more precise forecast. An important aspect of forecasting is providing useful uncertainty ranges; the narrowed range in August thus has a beneficial impact for stakeholders. As can be seen in Figure 1, the September 2019 extent falls very near the long-term trend line. In the past, Outlooks have performed well when the observed extent is near the trend line (Stroeve et al., 2014). Outlier years are more difficult to predict and the performance of Outlooks in such years has generally been less skillful.

In comparing the different methods, the best performance method varied by month (Figure 4). For example, statistical methods performed best in June and July, with the two estimates bracketing the observed extent. However, the statistical approaches dropped too low in August, while the dynamic models honed in most closely to the observations. The dynamic model interquartile range just barely encompassed the observed extent in all three months, with the median extent falling above observed. On the other hand, the decrease of the spread of dynamic models in the August outlook indicates what we discussed earlier in the report: the changing atmospheric conditions influenced the ice retreat at the end of summer, which the dynamic models were possibly able to catch. The statistical interquartile range encompasses the observations well in June and July, but not in August. Heuristic and other methods had a limited number of contributions, making assessments more difficult. In general, heuristic methods projected a lower September ice extent than observed.

Summer Conditions
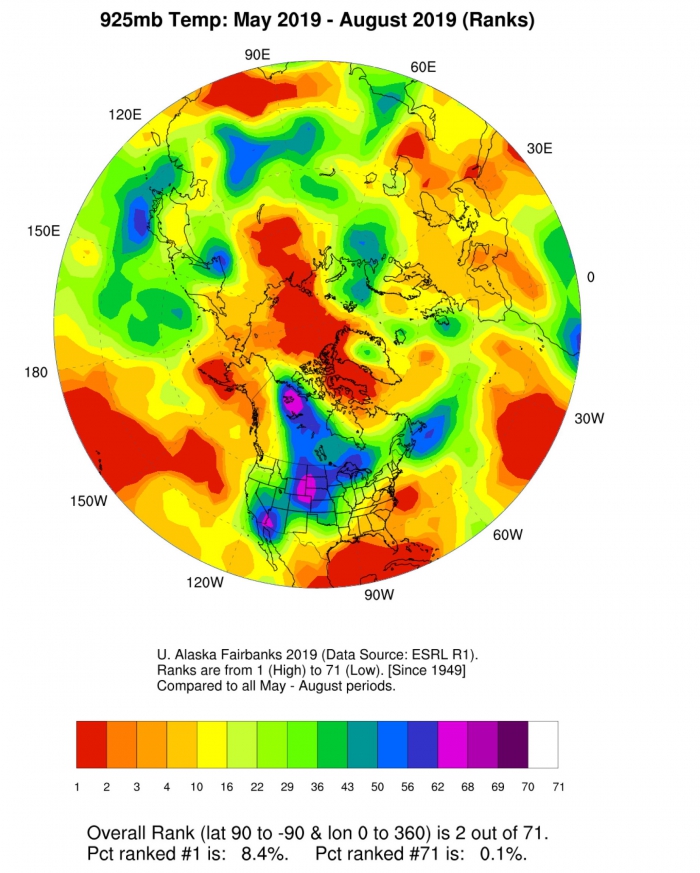
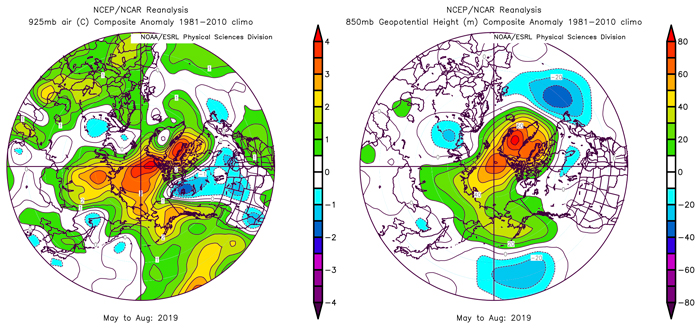
Summer 2019 temperatures were anomalously warm in the Arctic, with a large area from northern Greenland across the North Pole to the Taymyr Peninsula ranked as the warmest mean May–August 925 mb temperature during the past 71 years of the NCEP/NCAR reanalysis (Figure 5). Poleward of 70˚N, May and August ranked as warmest, June as second warmest, and July as third warmest over the 1949–2019 record based on 925 mb air temperature from the NCEP/NCAR reanalysis. Seasonal (May–August) temperature anomalies (Figure 6a, left) ranged from 2.5 to 4˚C above normal in the central Arctic, high Canadian Arctic, Laptev Sea, and Chukotka. The seasonal 850 mb geopotential height anomalies (Figure 6b, right) compare favorably with the negative phase of the Arctic Oscillation. The Arctic Oscillation Index averaged over May–August 2019 was -0.86 (See the NOAA National Centers for Environmental Information (NCEI)), which favors a reduction of sea-ice area by convergence of the ice edge (Ogi and Wallace, 2007). The low 2019 sea-ice extent is associated with these Arctic summer temperatures and circulation patterns that were favorable for ice loss.
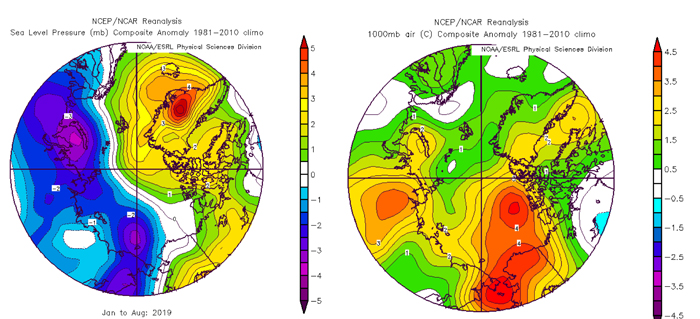
Within the Arctic, positive pressure anomalies extending from the Greenland Sea westward across northern Canada combined with negative pressure anomalies across the Russian Arctic seas to produce the positive phase of the Arctic Dipole pattern (Wang et al. 2009). This pattern favors stronger-than-normal wind-driven ice transport from the Pacific sector to the Atlantic sector of the Arctic. In addition, temperature advection associated with this pattern favors the large positive temperature anomalies over the Pacific Subarctic and the absence of such anomalies over the Atlantic side of the Arctic Ocean (Figure 7b, right).
This dipole pattern resulted in large poleward departures in the location of the ice edge in the Pacific sector of the Arctic. In the Beaufort, Chukchi, East Siberian, and Laptev Seas, the ice edge was up to several hundred kilometers poleward from the historical (1981–2010) median ice edge location (See Figure 2). By contrast, the ice edge was generally close to its historical median position in the Atlantic sector from Fram Strait to the region north of the Barents Sea. Small southward departures were even observed immediately east of Svalbard. This pattern of departures from normal is consistent with the wind-forcing and associated ice drift over the January–August period of 2019, as shown by the departures from normal sea level pressures during this period (Figure 7a, left). While the temperature anomalies in the Bering, Chukchi, and Beaufort seas were amplified by the absence of sea ice, large-scale atmospheric circulation clearly shaped the spatial pattern of sea-ice anomalies in 2019.
References
Cavalieri, D. J., C. L. Parkinson, P. Gloersen, and H. J. Zwally. 1996, updated yearly. Sea Ice Concentrations from Nimbus-7 SMMR and DMSP SSM/I-SSMIS Passive Microwave Data, Version 1. Boulder, Colorado USA. NASA National Snow and Ice Data Center Distributed Active Archive Center. doi: https://doi.org/10.5067/8GQ8LZQVL0VL.
Fetterer, F., K. Knowles, W. N. Meier, M. Savoie, and A. K. Windnagel. 2017, updated daily. Sea Ice Index, Version 3. Boulder, Colorado USA. NSIDC: National Snow and Ice Data Center. doi: https://doi.org/10.7265/N5K072F8.
Ogi, M., and J. M. Wallace. 2007. Summer minimum Arctic sea ice extent and the associated summer atmospheric circulation. Geophysical Research Letters 34. doi:10.1029/2007GL029897.
Wang, J., J. Zhang, E. Watanabe, M. Ikeda, K. Mizobata, J. E. Walsh, X. Bai, and B. Wu. 2009. Is the dipole anomaly a major driver to record lows in Arctic summer sea ice extent? Geophysical Research Letters 36. L05706,
https://doi.org/10.1029/2008GL036706.
This 2019 Sea Ice Outlook Interim Post-Season Report was developed by the SIPN2 Leadership Team
Report Lead:
Walt Meier, National Snow and Ice Data Center
Additional Contributors:
Uma Bhatt, University of Alaska, Geophysical Institute
Rick Thoman, Alaska Center for Climate Assessment and Policy, International Arctic Research Center, University of Alaska
John Walsh, International Arctic Research Center
Editors:
Betsy Turner-Bogren, ARCUS
Helen Wiggins, ARCUS
Lisa Sheffield Guy ARCUS
Kuba Grzeda ARCUS
Suggested Citation:
Meier, W., U. S. Bhatt, J. Walsh, R. Thoman, M. Serreze, M. Steele, M. Wang, H. Eicken, M. Hardman, P. Bieniek, E. Blanchard-Wrigglesworth, C. M. Bitz, L. C. Hamilton, E. Hunke, T. Jung, J. Kurths, J. Little, F. Massonnet, J. E. Overland, J. Stroeve, and H. V. Wiggins. Editors: Turner-Bogren, B., H. V. Wiggins, L. Sheffield Guy, and K. Grzeda. October 2018. "2019 Sea Ice Outlook Interim Post-Season Report."
Published online at: https://www.arcus.org/sipn/sea-ice-outlook/2019/interim
This Sea Ice Outlook Report is a product of the Sea Ice Prediction Network–Phase 2 (SIPN2), which is supported in part by the National Science Foundation under Grant No. OPP-1748308. Any opinions, findings, and conclusions or recommendations expressed in this material are those of the author(s) and do not necessarily reflect the views of the National Science Foundation.


