Outlook Report
Executive Summary
Thank you to the groups that contributed to this 2019 June Sea Ice Outlook (SIO) report. We received 31 contributions that include pan-Arctic predictions; of those contributions, six also included pan-Antarctic predictions, and nine included predictions for Alaskan waters. This year, for the first time, there are also seven predictions for the Hudson Bay region.
For the pan-Arctic, the median June Outlook value for September 2019 sea-ice extent is 4.40 million square kilometers with quartiles of 4.2 and 4.8 million square kilometers (see Figure 1 in the Overview section, below). The individual outlooks are based on statistical, dynamical models, and heuristic methods. Projected extents are slightly lower compared with 2018 June outlook, but are about the same as in the 2017 June outlook (4.43 million square kilometers). The spread is slightly larger compared with the previous two June Outlooks.
To place this year's Outlook in context, the historical low record was set in 2012 at 3.6 million square kilometers, and the second lowest record was 4.3 million square kilometers set in 2007. For September 2019, three estimates are below 4.0 million square kilometers (two by statistical method and one by heuristic). Only one entry suggests a new record (3.06 million square kilometers).
Again, this year, statistical and heuristic approaches projected generally lower September sea-ice extent compared to the overall median, and there was a considerable spread in projections from numerical models.
The June report is the product of the Sea Ice Prediction Network–Phase 2 (SIPN2) effort. The goal of the previous SIPN1 was to enhance scientific discussion on the physics that control summer sea-ice extent. SIPN2 goes deeper into quantitative comparisons of model forecast output. For the second year, all participants whose methods provided information at the local scale were encouraged to provide full spatial fields via the SIPN Data Portal for computation of metrics such as sea ice probability (SIP) and first ice-free (IFD), as well as additional regional analyses.
This report includes sections on: predicted spatial fields with discussion of sea-ice probability (SIP) and first ice-free dates (IFD) from a number of dynamical and statistical models; current conditions with discussion of this past winter's record low ice extent and atmospheric conditions; ocean heat; regional sea-ice conditions; and Antarctic sea-ice extent.
Contributions to the 2019 SIPN/Year of Polar Prediction community forecast experiment, the Sea Ice Drift Forecast Experiment (SIDFEx), are still coming in and will be discussed when available.
This June Outlook was developed by lead authors Muyin Wang, University of Washington (Overview and discussion of current conditions) and James Overland, NOAA Pacific Marine Environmental Laboratory (PMEL) (Overview and discussion of current conditions); with contributions from Edward Blanchard-Wrigglesworth and Cecilia Bitz, University of Washington (Discussion on predicted spatial fields); Michael Steele, University of Washington (Discussion of ocean heat); Uma Bhatt, John Walsh, and Rick Thoman, University of Alaska Fairbanks (Discussion of ice conditions in the Bering and Chukchi seas); Julienne Stroeve, University of Manitoba (Discussion of ice conditions in the Hudson Bay region); Francois Massonnet, Université catholique de Louvain (Discussion of Antarctic contributions); Bruce Wallin and Molly Hardman, NSIDC (statistics and graphs); Betsy Turner-Bogren, Helen Wiggins, and Stacey Stoudt, ARCUS (report coordination and editing); and the rest of the SIPN2 Project Team.
Please note: The Sea Ice Outlook provides an open process for those interested in Arctic sea ice to share predictions and ideas; the Outlook is not an operational forecast.
See June call for contributions
Overview
The median June Outlook value for a September 2019 sea-ice extent is 4.40 million square kilometers with quartiles of 4.2 and 4.8 million square kilometers (Figure 1). Contributions are based on statistical (13 inputs), dynamical models (14 inputs), and heuristic methods (4 inputs). Projected extents are slightly lower compared with 2018 June outlook (4.6 million square kilometers), but are about the same as those in the 2017 June outlook (4.43 million square kilometers). The projections range from 3.06 to 5.90 million square kilometers, which is greater than the range in 2018. Only one projection is for a new record low (below the mark of 3.60 set in 2012), but two more projections are for a sea-ice minimum below 4 million square kilometers. The median value of the projected September sea-ice extent is right along the linear trend line.

Again, as in previous years, the spread in the dynamical models are larger compared with statistical models (Figure 2). Overall, the heuristic method has the lowest projected September sea-ice extent value with a median at 4.09 million square kilometers, and the dynamical models have the highest number with the median at 4.56 million square kilometers.

Figure 3 shows the historical data for September sea-ice extent. Extent for recent years is near the long term downward trend line. Extreme minima in 2007 and 2012 appear to be singular events that were forced by warm temperatures and an unusual pattern of winds.

Predictions from Spatial Fields (SIP and IFD)
As in recent years, we have invited outlooks for sea-ice probability (SIP) and first ice-free date (IFD). Three participants provided these fields directly (Modified CanSIPS, NASA GMAO), which gives them the opportunity to bias-correct their fields. Additionally, SIPN2 is now computing SIP and IFD from forecasts of sea-ice concentration (SIC) submitted directly by contributors, and we encourage all groups to submit full field SIC forecasts whenever possible. However, we do not bias correct any fields.
SIP is defined as the fraction of ensemble members in an ensemble forecast with September ice concentration in excess of 15%. IFD is the first date in the melt season at which the ice concentration at a given location first drops below 15%. So far this year, we have received 12 submissions of SIP (9 dynamical, 3 statistical) and seven submissions of IFD (7 dynamical, 1 statistical). We typically have fewer estimates of IFD because daily SIC forecasts are needed, yet some participants only provide monthly SIC forecasts. We show SIP forecasts in Figure 4. Most forecasts are for a low probability of ice in the Chukchi and Laptev seas. Elsewhere, forecasts are uncertain, with a significant spread across models, particularly in the Beaufort, northern Chukchi and East Siberian seas, where some contributions have high probability of ice presence (e.g., Met Office, the Norwegian Meteorological Institute, and NSIDC CU Boulder.), and others have low probability (e.g., IAP LASG, U.W APL, Lamont, and Nico Sun). There is a high chance for the Northeast Passage to be ice free this summer (mean SIP of ~10-20%). In Figure 5 we show forecasts of IFD. There is significant uncertainty (~30 days) in large areas around the sea ice edge, peaking in the eastern Beaufort.
Editor's note: Figures 4 and 5, as well as the accompanied text, were updated on 26 June 2019.

In Figure 5 we show forecasts of IFD. There is significant uncertainty (~30 days) in large areas around the sea ice edge, peaking in the eastern Beaufort.

Current Conditions
Sea-ice extent averaged for May 2019 was the second lowest in the satellite passive microwave record, falling just below 2016 (Figure 6, NSIDC), although April 2019 was a new low record. Recent years (2016, 2018, and 2019) have had less early June sea ice than was the case in 2007 and 2012 which, respectively, ended up with the two lowest recorded September extents in the satellite era.

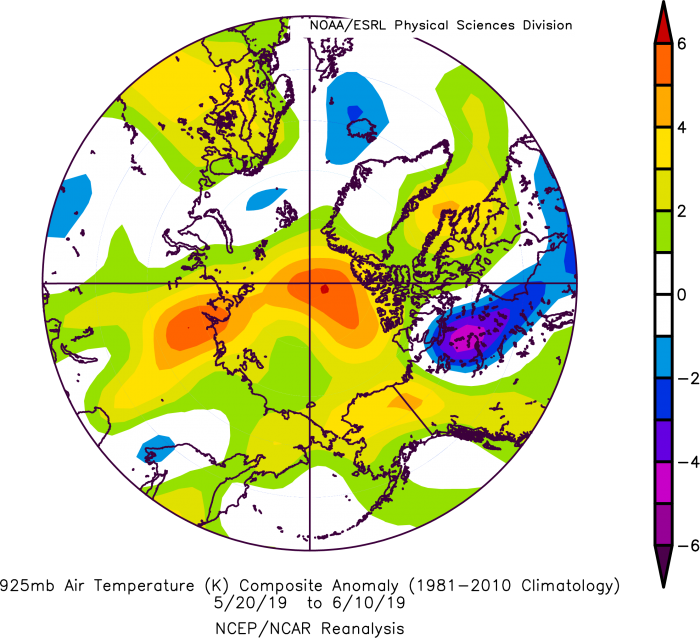
The early June sea-ice concentration map (Figure 7, NSIDC) shows open water and low concentration ice in the Chukchi and eastern Beaufort seas, northern Baffin Bay, northern Barents Sea, and low concentrations along the Siberian coast. The air temperature anomaly plot for 20 May through 10 June at the 925 hPa level (approximately 2,500 feet above the surface) shows positive departures from normal over most of the Arctic, especially over northern Alaska, Baffin Bay, and north of Canada across the North Pole (Figure 8). Such conditions are consistent with the atmospheric wind pattern (Figure 9); wind directions broadly follow the contours of the 850 hPa geopotential height field. A center of high geopotential height (i.e., the height of a constant atmospheric pressure surface about 15% above the surface) over Greenland and extending north of Canada brought warm air from Alaska into the central Arctic Ocean. Inferred winds from the north, blowing down Fram Strait and along the east coast of Greenland, imply stronger than average advection of sea ice out of the Arctic Basin. Winds from the east along northern Alaska support loss of sea ice in that coastal region and warm temperatures and winds from the south in Baffin Bay support sea ice loss there. Further, substantial winds from the east along the Siberian coastline may have contributed to low sea-ice concentration in that area.

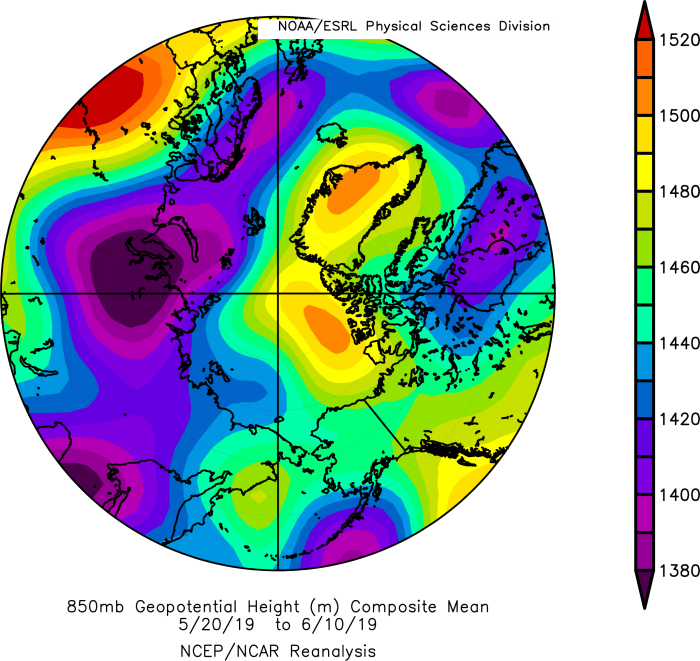
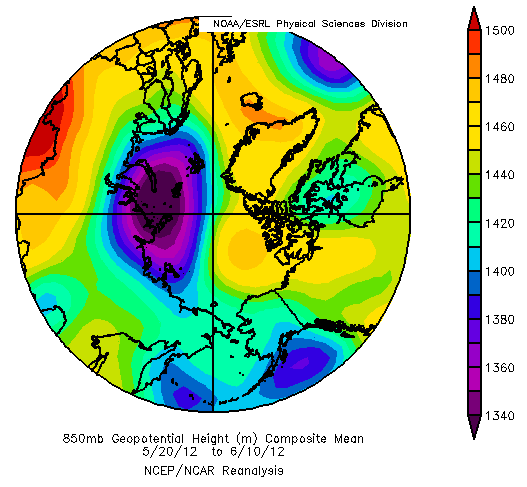
The 850 hPa geopotential height field averaged for 20 May through 10 June 2012 (Figure 10) shows similarities with the current pattern, with high geopotential heights over the Beaufort Sea in both years and low geopotential heights on the Eurasian side. For 2012 this "dipole" pattern, known to favor sea-ice loss during the ice-retreat melt season, persisted through summer and early autumn.
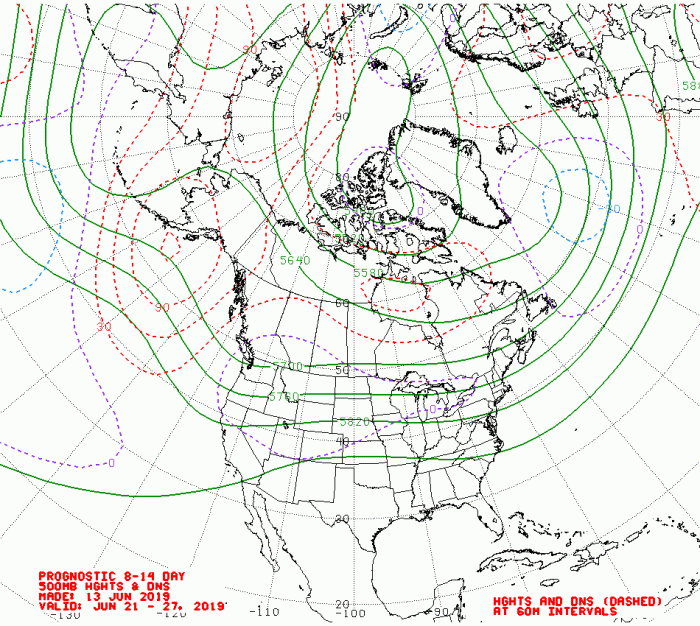
The 13–27 June two-week forecast of meteorological conditions from the Climate Forecast System (CFS) (Figure 11) shows a maintenance of high geopotential heights north of Canada and extending out over the central Arctic (green contours of 500 hPa geopotential heights). A strong jet stream (close contour spacing) is projected over the central Pacific, North America, and North Atlantic. These features tend to isolate the Arctic from mid-latitude impacts and suggest that the current basic weather pattern will continue through at least late June.
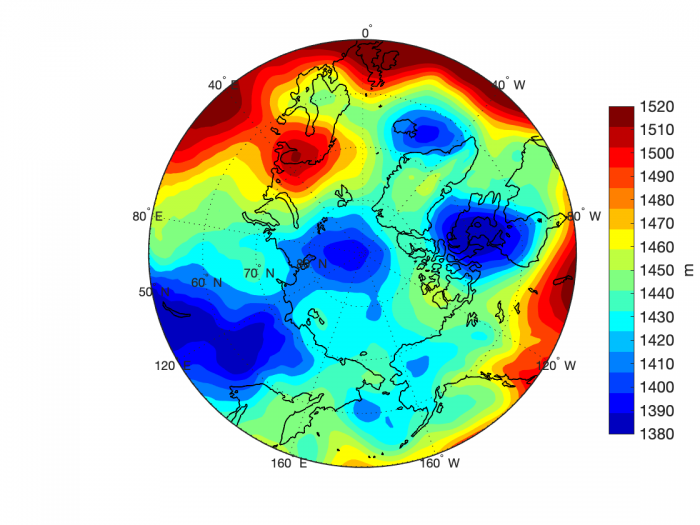
The Climate Forecast System version 2 (CFSv2) is a global model that includes the interactions between Earth's oceans, land, and atmosphere. It is produced by scientists under guidance from the National Centers for Environmental Prediction (NCEP) and provides weather predictions out to nine months. The CFSv2 projection for 12 July 2019 of geopotential height at the 850 hPa level (Figure 12) is for continuation of high pressure north of Canada and extending westward through the Chukchi Sea. This contrasts with the past several years, when low pressure has dominated the central Arctic Ocean through summer.
In summary, the situation thus far in the 2019 retreat season and the available projections point towards substantial summer ice loss, and as noted above, extent for the Arctic as a whole is already well below average. However, the atmospheric circulation pattern can change during the late summer, with corresponding impact on slowing the seasonal retreat of sea ice.
Ocean Heat Discussion
There are large areas of open water in the peripheral seas of the Arctic Ocean. This creates favorable conditions for atmospheric heating of the ocean surface (Figure 13). Warm sea-surface temperatures (SSTs) are especially notable in the northeast Chukchi Sea, with lesser but still notable warmth in the eastern Beaufort, Laptev, and Barents seas, and eastern Baffin Bay. Later in the summer, ocean heating can be influenced by warm ocean currents from the south and (to a lesser extent) warm river inputs (especially in the Mackenzie region). However, at this early stage most of this warmth is likely from atmospheric heat input that begins as soon as the ice retreats. A good example is the northeast Chukchi Sea, which warms quickly in response to ice retreat forced by winds from the east. After this initial warming, a second warming phase will commence as warm Alaska Coastal waters make their way into this area and beyond. SSTs are presently quite high, but within range of previous years. Particularly notable this year is the ice retreat and associated increase in SSTs to the north of Alaska in the western Beaufort Sea, an area that typically takes at least another approximately six weeks to reach this stage (e.g., Steele, M., S. Dickinson, J. Zhang, and R. Lindsay. 2015. Seasonal ice loss in the Beaufort Sea: Toward synchrony and prediction, J. Geophys. Res. Oceans 120: 1118–1132, doi:10.1002/2014JC010247.).
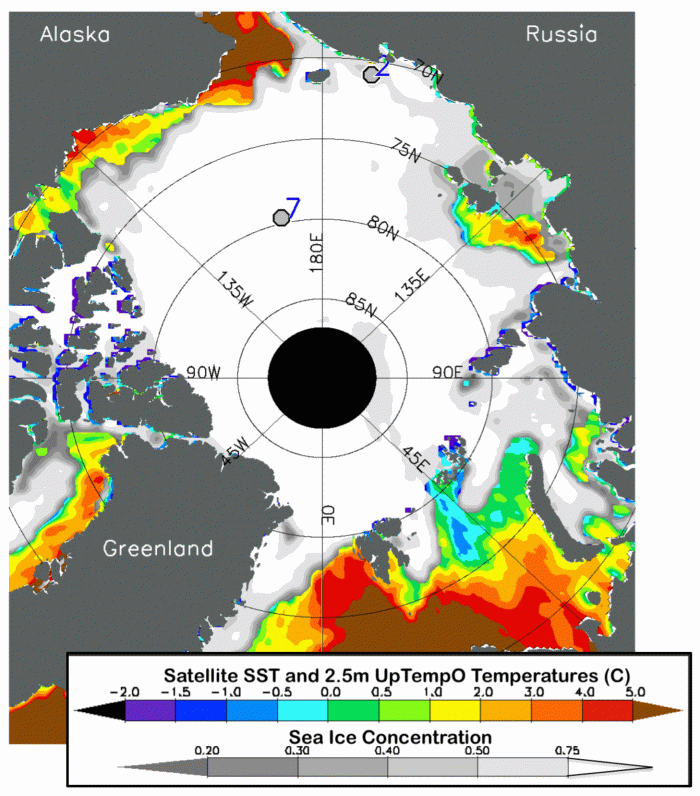
Note: Figure 13 is sourced from NOAA dOISST and NSIDC NRT passive microwave. Data for UpTempO drifting buoys locations is available for downloading here.
Regional Sea Ice Extent Discussions
Alaska Region
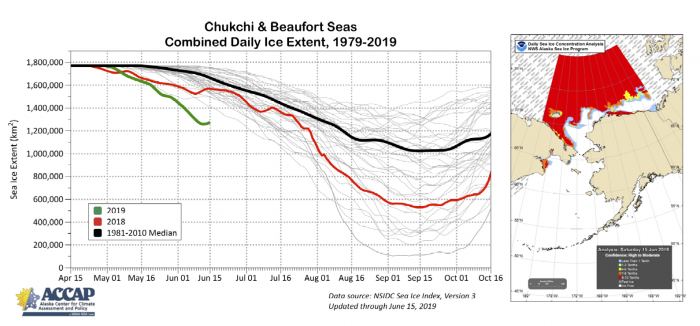
The combined Chukchi and Beaufort sea-ice extent thus far in the 2019 retreat season is lower than in any previous year of the satellite record (Figure 14). Individually, both seas are also lower on 15 June than in past retreat seasons, though the timing previous record low years differ between the Beaufort and Chukchi seas (i.e., they are not coincident). In the Chukchi Sea, the current sea-ice extent is lower than at the same time in 2018 and slightly above the June 15th extent of 2017. For the Beaufort Sea, the sea-ice extent is below previous low years of 1998 and 2016. So far in 2019, sea-ice retreat has been faster than in past years with the record warmth in May and June in the North American Arctic. Weather systems and their ocean impacts can strongly alter the trajectory of regional ice extent, as shown by the temporary reversals of ice loss in mid-June of 2019 and in both June and July of 2018 (Figure 14). While these events serve as reminders that upcoming summer conditions will still determine whether the Beaufort-Chukchi ice extent remains unprecedentedly low, the early retreat in 2019 favors a minimum ice extent in the lower portion of the historical distribution.

In the Alaskan regional sea-ice extent prediction, among the 9 contributions we received, three of them are based on statistical method, and six of them are based on dynamical models (Figure 15). Forecasts range from 0.12 million square kilometers to 7.1 millions square kilometers.
Hudson Bay Region
Hudson Bay is one of the least studied regions of the Arctic, yet is home to 40 communities that rely upon the sea ice for travel, hunting, and marine access. With increased mining operations and the potential for winter shipping, interest in forecasting sea ice conditions in this region is growing.
At the end of May, sea ice had already started to retreat within the northern part of Hudson Bay and open water formed near Rankin Inlet. Some open water also started to form around Akimiski Island. Open water formation in May is not unusual in Hudson Bay, and overall the May monthly sea ice extent in Hudson Bay of 1.23 million square kilometers was more extensive than the 1981–2010 climatological mean of 1.22 million square kilometers. By June 19th, open water became more expansive within Hudson Bay, and the sea ice extent dropped to 1.00 million square kilometers. This however remains considerably more extensive than the minimum of 763,675 square kilometers for this time of year observed in 2010. Generally, by September most of Hudson Bay is completely ice-free though some ice usually remains around South Hampton Island. This year we had six regional forecasts of September sea ice extent for Hudson Bay that ranged from no sea ice (four of the forecasts) to 810,000 square kilometers of ice remaining. The forecast for extensive ice remaining was based on the NEMO3.6/LIM3 dynamic ocean-sea ice model. The 1981–2010 average for September is 29,678 square kilometers.
We also show a forecast of the first ice-free date of Hudson Bay (Figure 16), which has the earliest ice-free dates near where the observed ice retreat was earilist this year. Most forecast show the Hudson Bay becoming nearly ice-free by the end of June or early July, but a few models have ice lingering until mid to late July.

Editor's note: Figure 16 was updated on 26 June 2019.
Lincoln Sea and Nares Strait
Ice Arch Break Up in the Lincoln Sea (From NSIDC, Arctic Sea Ice News)
In most years (2007 being a notable exception), an ice arch forms during late autumn and winter at the north end of Nares Strait, the narrow passage that separates Greenland from Ellesmere Island. This arch acts as a barrier, preventing ice from the Arctic Ocean from drifting through the strait and into Baffin Bay. The arch typically breaks up in June or July, allowing ice to drift through the narrow channel. This year, the arch broke up by late March, much earlier than is typical. Since then, there has been a steady flow of ice through Nares Strait (download animation to view). Since 2000, only four other years appear to have had similar early breakups of the arch: 2007 (when no arch formed at all), 2008, 2010, and 2017 (Moore et al., 2018). Typically, strong wind events trigger the break up, but warm temperatures and thinner ice can also contribute.
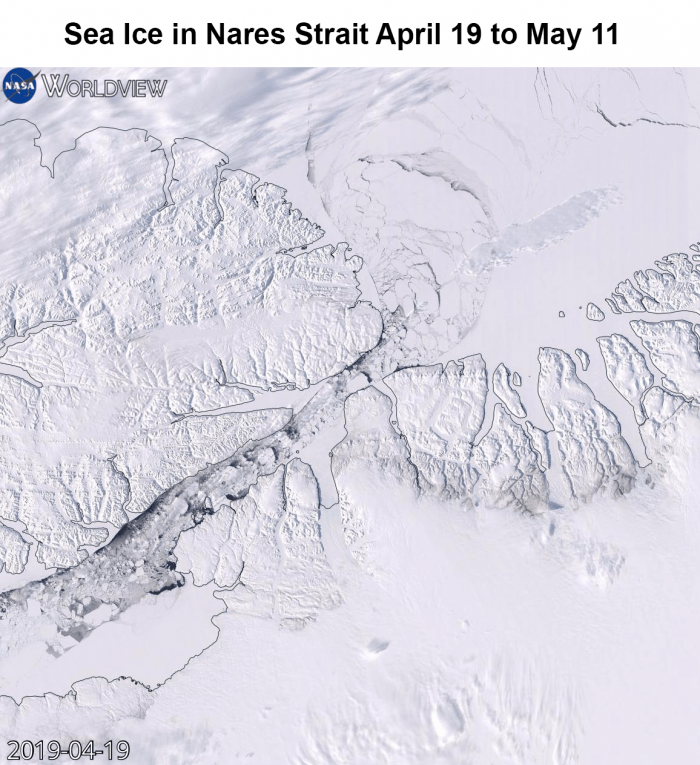
Note: Download an animation of the above image here.
Antarctic Discussion
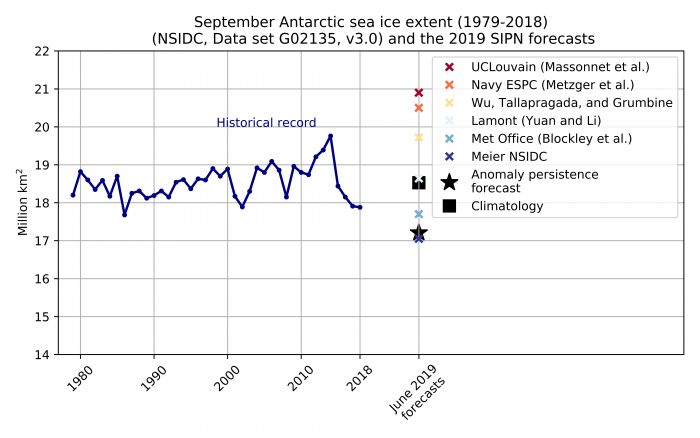
As was the case last year, there were several submissions for Antarctic ice extent. This year, six outlooks of September mean sea-ice extent were received (compared to 12 for last year). The six forecasts span a range of 17.0–20.9 million square kilometers (Figure 18), which largely surpasses the range in the observed satellite record. This is a remarkable range compared to the Arctic submissions. From the (small) ensemble available, it can be surmised that the prediction systems taken together will probably not outperform a climatological or a persistence-based forecast. The next set of submissions (July and August) may be telling in this regard. Caution should be exercised in interpretation of the results as the circumpolar sea-ice extent is a diagnostic with little physical relevance. The sister project of SIPN2, the Sea Ice Prediction Network South (SIPN South, http://acecrc.org.au/sipn-south/) aims at analyzing in more detail the (summer) Antarctic sea ice forecasts, understand the regional expressions of forecast biases, and deliver information that is more tailored to end users.
Partner Activities
The Third Session of the Pan-Arctic Regional Climate Outlook Forum (PARCOF-3) convened May 2019 in Rovaniemi, Finland and developed a Consensus Statement for the Arctic Summer 2019 Season Outlook:
To meet climate adaptation and decision-making needs in the Arctic, substantial progress has been made towards the establishment of an Arctic Regional Climate Centre Network (ArcRCC-Network). The ArcRCC-Network is based on the World Meteorological Organization (WMO) RCC concept with active contributions from all the Arctic Council member countries. The Pan-Arctic Regional Climate Outlook Forum (PARCOF) is a flagship activity of the ArcRCC-Network to create a forum to meet directly with Arctic users of climate information, and follows the well-known Regional Climate Outlook Forum (RCOF) concept supported by WMO and its partners around the world. The ArcRCC is now in the second year of its demonstration phase. (The full statement and related figures are provided as a PDF in the Supplemental Material Section below.)
Editor's note:
 Getting to know the people who contribute to the Sea Ice Outlook Reports is always a privilege. It was a special privilege to correspond with Preben Gudmandsen, who contributed sea ice observations of the Nares Strait to our reports for many years. In response to our call for contributions in 2017, Preben wrote, "A word of warning: I have lived for 92 years so one day sooner or later I shall not be able to answer your mails and without a secretary or a wife nobody will tell you."
Preben Gudmandsen, aged 94, died at the beginning of May 2019. His contributions to the Sea Ice Outlook reports will be missed. According to his obituary, Gudmandsen was one of the first to engage in remote sensing activities from aircraft and satellites in Denmark. In 1972 he started the application of satellite data from passive microwave sensors for mapping sea ice in the waters around Greenland. His full obituary is available on the Technical University of Denmark website.
References
Steele, M., Dickinson, S., Zhang, J., and Lindsay, R. ( 2015), Seasonal ice loss in the Beaufort Sea: Toward synchrony and prediction, J. Geophys. Res. Oceans, 120, 1118– 1132, doi:10.1002/2014JC010247.).
Contributor Key Statements, Summary of Uncertainties
![]() Summary Table of Key Statements from Individual Outlooks
Summary Table of Key Statements from Individual Outlooks
Contributor Full Report PDFs and Supplemental Material
This report was developed by the SIPN2 Leadership Team
Report Leads
Muyin Wang, University of Washington and the Joint Institute for the Study of the Atmosphere at the University of Washington
Jim Overland, NOAA/Pacific Marine Environmental Laboratory
Additional Contributors:
Rick Thoman, Alaska Center for Climate Assessment and Policy, International Arctic Research Center, University of Alaska
Molly Hardman, Cooperative Institute for Research in Environmental Sciences at the University of Colorado Boulder, NSIDC
Editors:
Betsy Turner-Bogren, ARCUS
Helen Wiggins, ARCUS
Stacey Stoudt, ARCUS
Lisa Sheffield Guy, ARCUS
Suggested Citation:
Wang, M. and Overland, J.E., U.S. Bhatt, P. Bieniek, E. Blanchard-Wrigglesworth, H. Eicken, M. Hardman, L. C. Hamilton, J. Little, F. Massonnet, W. Meier, M. Serreze, M. Steele, J. Stroeve, R. Thoman, B. Wallin, J. Walsh, and H. V. Wiggins. Editors: Turner-Bogren, B., L. Sheffield Guy, S. Stoudt, and H. V. Wiggins. June 2019. "Sea Ice Outlook: 2019 June Report." (Published online at: https://www.arcus.org/sipn/sea-ice-outlook/2019/june.)
This Sea Ice Outlook Report is a product of the Sea Ice Prediction Network–Phase 2 (SIPN2), which is supported in part by the National Science Foundation under Grant No. OPP-1748308. Any opinions, findings, and conclusions or recommendations expressed in this material are those of the author(s) and do not necessarily reflect the views of the National Science Foundation.


