Outlook Report
Executive Summary
First, we would like to express our sincere thanks to all the groups and individuals who have submitted their contribution to the 2021 June Sea Ice Outlook (SIO) report and for your continuous support during these difficult times.
We received 38 contributions of September sea-ice extent that included pan-Arctic predictions; of those contributions, eight also included predictions for pan-Antarctic, seven included predictions for the Alaska Region (Bering, Chukchi, and Beaufort seas), and 14 submitted September mean sea-ice extent anomalies.
This report includes discussions on Current Conditions in the Arctic, Ocean Heat, Predictions from Spatial Fields (Sea-Ice Probability, Ice-Free date, Initial conditions), Arctic Regional Sea-Ice Extent, Arctic Sea Ice Anomalies, Antarctic Contributions, SIO Contributor Motivations, and the emerging pattern in the Sea Ice Outlooks.
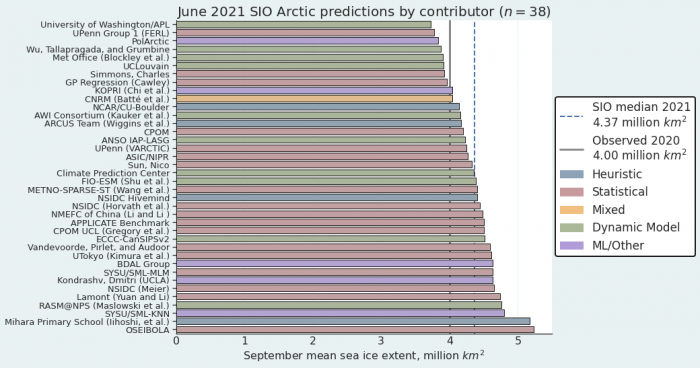
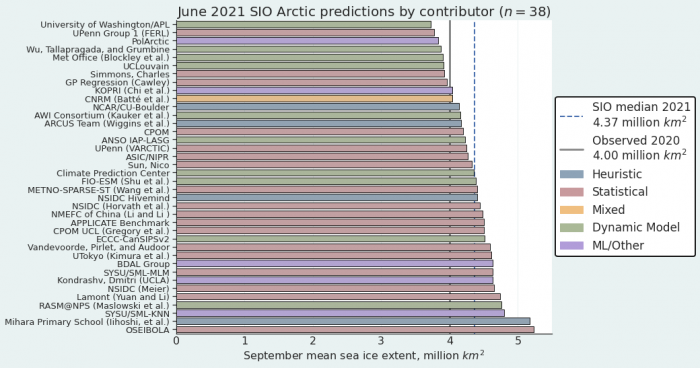
For the Arctic, the median June Outlook for September 2021 average sea-ice extent is 4.37 million square kilometers with quartiles of 4.07 and 4.61 million square kilometers. For comparison, the historical record September low over the period of satellite observations was set in 2012 at 3.57 million square kilometers, and the second lowest record was 3.92 million square kilometers set in 2020. This year's projection is higher than the 2019 observed September sea-ice extent of 4.32 million square kilometers, and also higher than the June 2020 Sea Ice Outlook number, 4.33 million square kilometers.
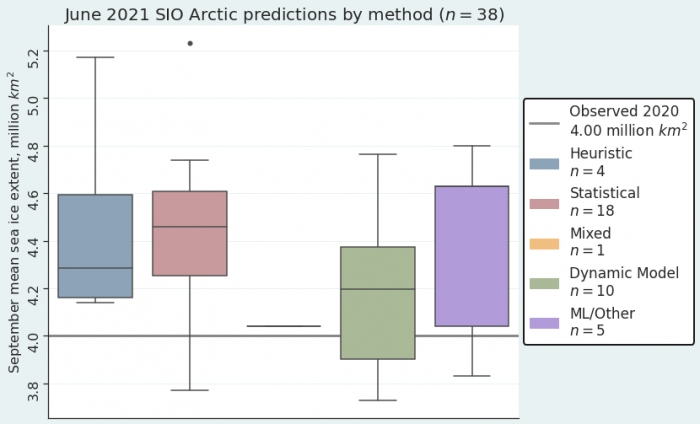
There is a larger spread among different methods compared to the 2020 June Outlook. The median values are 4.20 (Dynamical), 4.29 (Heuristic), 4.46 (Statistical), and 4.63 (Machine Learning) million square kilometers, respectively.
Forecasts of Sea-Ice Probability (SIP) almost unanimously agree in low September SIPs compared to past years' forecasts. Low SIPs in the Chukchi and Laptev seas are expected, and all forecasts show an open Northeast Passage. There is considerable forecast uncertainty of Ice-Free Date (IFD) in some regions. Forecast initial conditions of sea-ice concentration generally show good agreement across the different models, with concentrations close to 100% over much of the Arctic Ocean. In contrast, forecast initial conditions of sea-ice thickness show less agreement across models. (See: Predictions from Spatial Fields Discussion below).
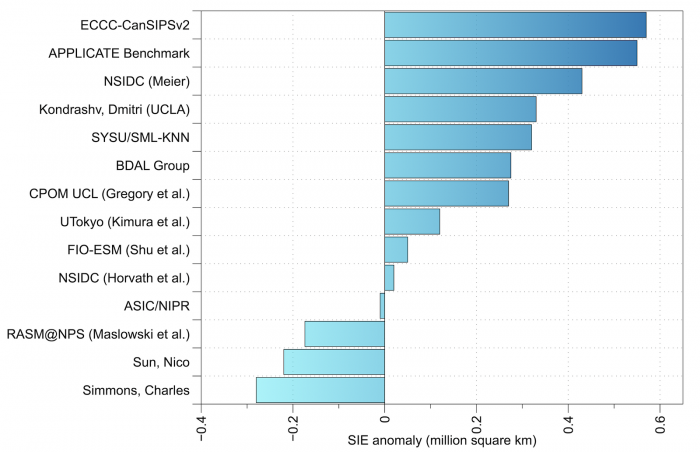
This is the first year that the SIO has solicited September mean sea-ice extent anomalies and this request emerged from the January 2021 SIO Contributor's Forum. The exercise is motivated by the large spread in SIO predictions of mean September sea-ice extent and seeks to examine if the spread is reduced when the inter-model bias is removed. The 14 contributions of September mean sea-ice extent anomaly range from -0.28 to +0.57 million square kilometers, with a standard deviation of 0.51 million square kilometers. There are ten forecasts above and four below the contributors' baseline. (See: Arctic Sea Ice Anomalies Discussion below).
For the Alaskan Region, defined here as the Bering, Chukchi, and Beaufort seas, the combined sea-ice extent median among the seven contributions received is 0.67 million square kilometers. To put these forecasts in historical perspective, the September mean sea-ice extent averaged over 2007–2020 is 0.44 million square kilometers making the outlook for 2021 above all observed values since 2015. (See: Alaska Regional Sea-Ice extent Discussions below for details).
For the Antarctic, eight outlooks of September mean sea-ice extent were received (same as last year). These span a range of 16.50–20.78 million square kilometers, which is smaller by ~25% than the range of last year (15.70–21.30 million square kilometers). However, the spread largely surpasses the range in the observed satellite record. This is a remarkable range compared to the Arctic submissions. Among the eight submissions, there is a cluster of six contributions in a narrow range (18.30–18.89 million square kilometers). (See: Antarctic Contributions Discussion below).
The SIPN2 team conducted an online survey of contributors in order to enhance our understanding of the community and elicit how the SIO relates to their work. Among 23 contributors who responded, 16 indicated that they submitted to the SIO in order to compare their forecasts against those of other community members and 14 respondents indicated that they submitted a forecast to increase the profile of their organization. The majority of the respondents are from academic institutions (59%) and government agencies (22%). (See: SIO Contributor Motivations Discussion below).
Looking back at the 13-year (2008–2020) record of all June Sea Ice Outlooks, we found that there is a lack of correspondence between the median of all outlooks and the actual September observed value: the two time series correlate at r = 0.24. However, the observed and predicted time series correlate significantly (r = 0.86) when introducing a one-year lag difference. That is, the observed September extent of a given year is a very good predictor of the SIO predictions issued the next year. (See: Predicting Predictions: An Emerging Pattern in the Sea Ice Outlooks Discussion below).
This June Outlook was developed by lead authors Muyin Wang, University of Washington (Executive Summary, Overview, and discussion of Current Conditions) and James Overland, NOAA Pacific Marine Environmental Laboratory (PMEL; Overview and discussion of Current Conditions); with contributions from Edward Blanchard-Wrigglesworth, University of Washington (Predictions from Spatial Fields Discussion); Michael Steele, University of Washington (Ocean Heat Discussion); Uma Bhatt, John Walsh, and Richard Thoman, University of Alaska Fairbanks (discussion of ice conditions in the Bering and Chukchi seas); Cecilia Bitz, University of Washington (spatial field figures); François Massonnet, Université catholique de Louvain (Antarctic Contributions Discussion and Predicting Predictions); Joseph Little (SIO Contributor Motivations); Matthew Fisher, NSIDC (statistics and graphs); Betsy Turner-Bogren, Helen Wiggins, Kuba Grzeda, Lisa Sheffield Guy, and Stacey Stoudt, ARCUS (report coordination and editing); and the rest of the SIPN2 Project Team.
Note: The Sea Ice Outlook provides an open process for those who are interested in Arctic sea ice, to share predictions and ideas; the Outlook is not an operational forecast.
See June Call for Contributions
Overview
The 38 Arctic June Outlook contributions for September 2021 sea-ice extent projections are again based on multiple approaches (Figure 1). There were four contributions using a heuristic or qualitative analysis approach (one more than 2020), 18 contributions using statistical methods (four more than 2020), and ten using dynamical models (i.e., based on fluid dynamics equations; six less than 2020). This year there are five inputs generated by Artificial Intelligence (AI)/Machine Learning (ML), up from two in the previous two years, and one by mixed methods (which is dynamic ensemble forecast with bias correction using 2020 error estimate). This year's median projected value is 4.37 million square kilometers with quartiles of 4.07 and 4.61 million square kilometers. This number is more than the SIO projected value of 4.33 million square kilometers for 2020, but less than the value of 4.40 million square kilometers for 2019 and 4.6 million square kilometers for 2018. Nine contributions projected September sea-ice extent to be less than four million square kilometers, and two contributions projected the sea-ice extent above five million square kilometers. Again, the median from the dynamic models is the lowest of all methods. None of the outlooks predict a new record low (i.e., below 3.57 million square kilometers set in 2012).
The projections from machine learning methods (purple colored box) have the largest spread among the five contributed outlooks, with a median of 4.63 and quartiles of 4.04 to 4.63 million square kilometers; dynamic models have the second largest spread of the ten contributed outlooks, with a median value of 4.20 million square kilometers, and quartiles of 3.90 and 4.38 million square kilometers. This spread is larger than the contributions from statistical methods, which have quartiles of 4.26 and 4.61million square kilometers. The four outlooks by heuristic methods have quartiles at 4.16 and 4.59 million square kilometers. This year, there is a larger spread in the median among the four methods (Figure 2) than what we saw in the June 2020 SIOs.
For the 2021 SIO June report, ten groups submitted supplemental materials (See: Contributor Full Reports and Supplemental Materials below). The supplemental material contents vary among the contributions but they may include information on methodology on: (1) how the forecasts are produced, (2) number of ensemble members used in the forecasts, (3) whether and how bias-corrections are applied, (4) ensemble spread, range of forecasts, uncertainties and other statistics, and (5) whether or not postprocessing was performed.
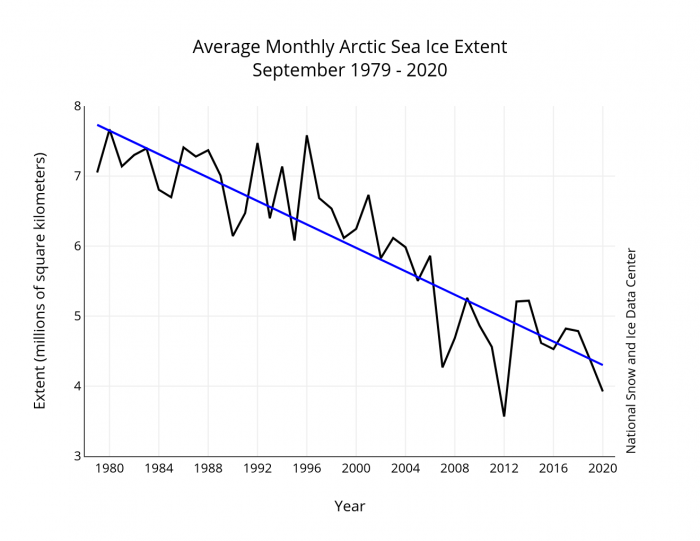
This year's outlook of 4.37 million square kilometers appears to fall on the linear trend line based on historical data for September sea-ice extent as shown in Figure 3. All estimates are in a narrow range (from 3.73 to 5.23 million square kilometers). Thus, there is a collective opinion that projections should be close to persistence (based on recent observations), and against rapid large decreases in summer Arctic sea-ice extent.
Current Conditions
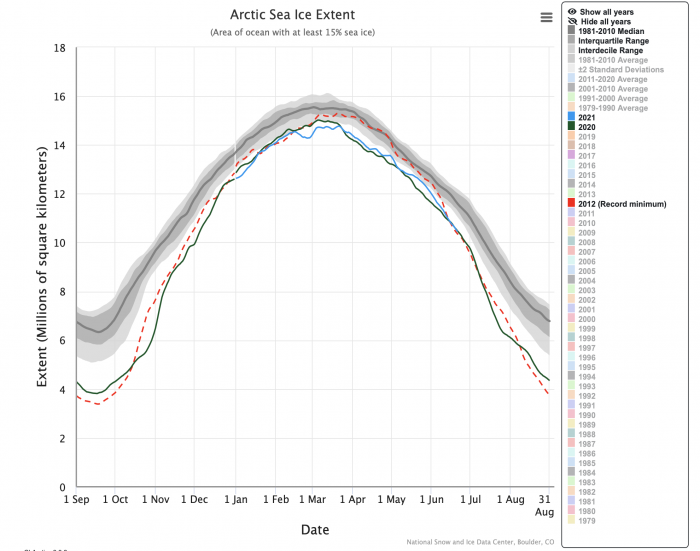
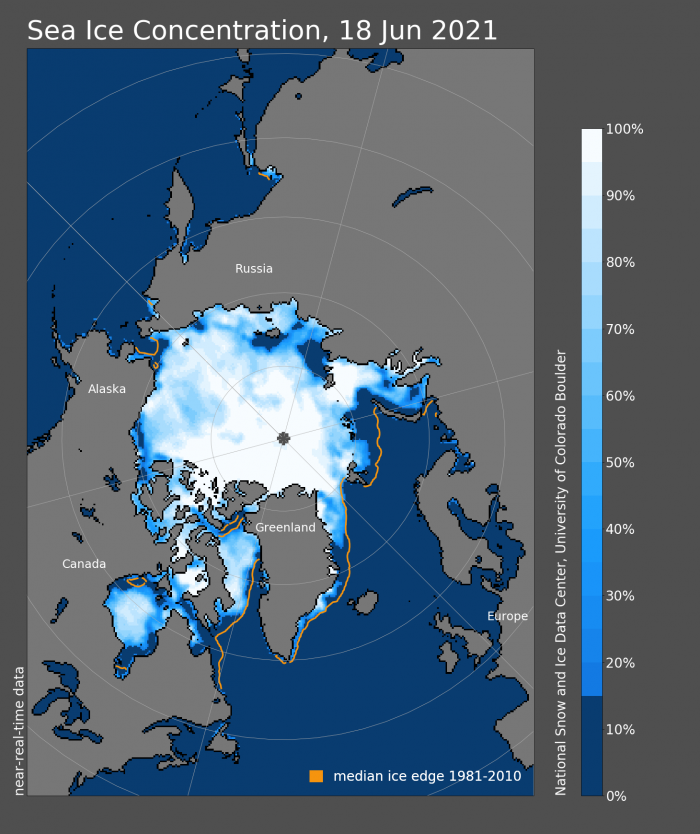
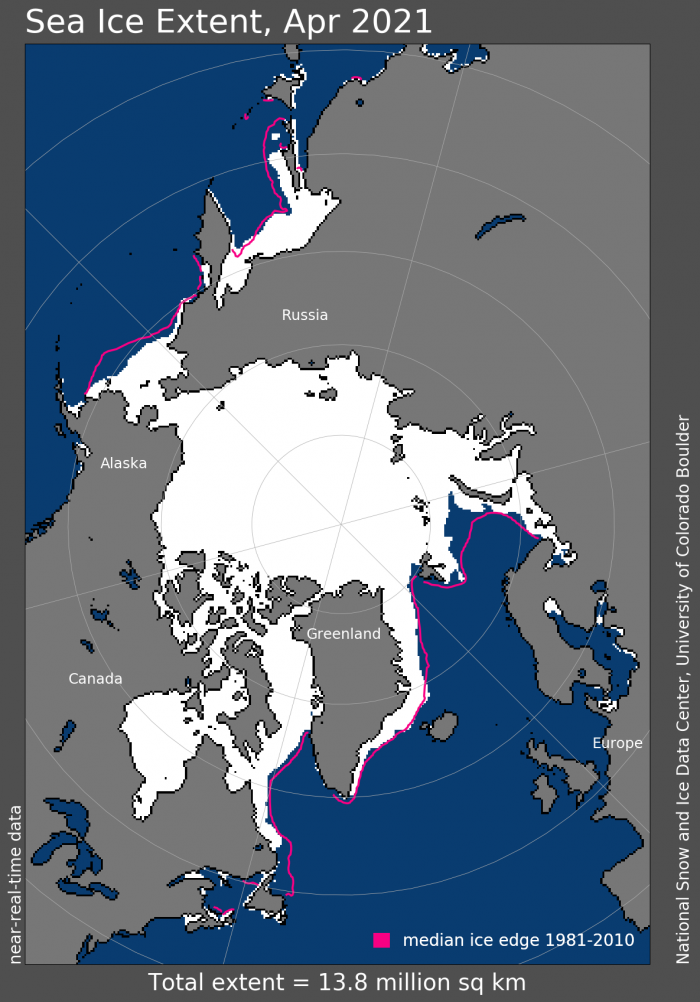
Despite a slow start to the freeze-up season leading to record low sea-ice conditions in October and November 2020, by the start of the melt season, the ice extent was not particularly unusual compared to ice conditions in the last decade, though sea-ice extent in April and May was overall lower than what was observed in 2012, the year with the previous record low September extent. By 14 June 2021, sea-ice extent was lower than the 1981–2010 median (Figure 4, NSIDC) most everywhere except within the Beaufort Sea (Figure 5, NSIDC). The most notable feature so far this summer are the large open water areas within the Laptev Sea, leading to the record low ice conditions in this region since 28 May. As a result, the overall sea-ice extent in June is currently tracking third lowest in the satellite record.
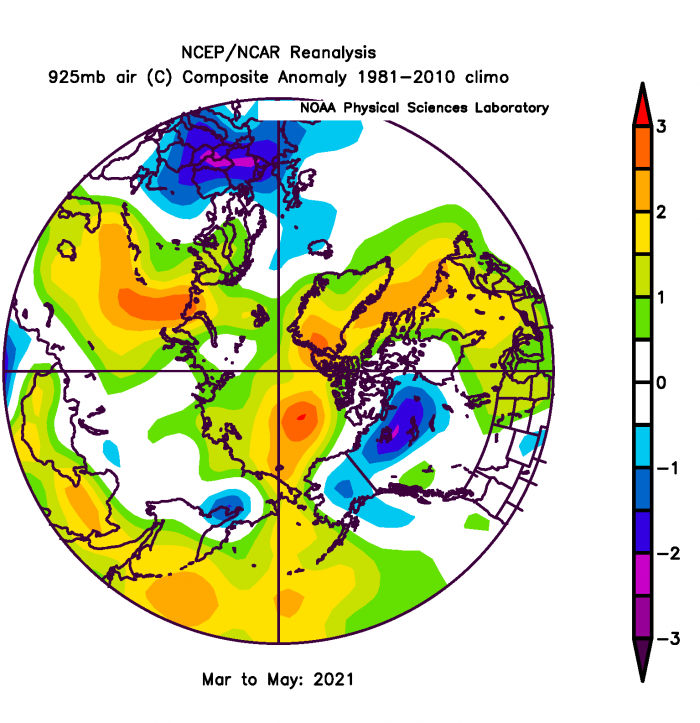
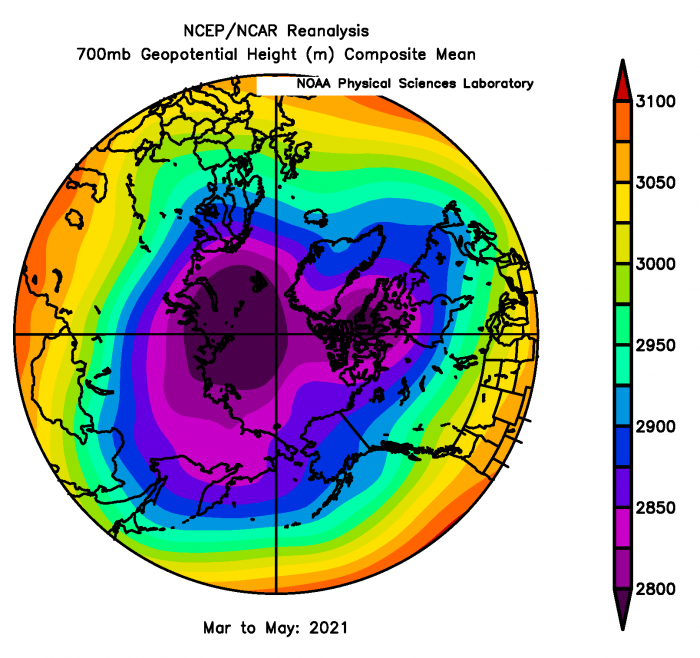
Near surface air temperatures for spring (March-May; Figure 6, ESRL/PSD) show weak positive anomalies over the Arctic of less than positive 3° C. Steering level winds of the springtime jet stream (Blue band, Figure 7, ESRL/PSD) shows that the Arctic was isolated from major interaction of heat transport between the subarctic and Arctic.
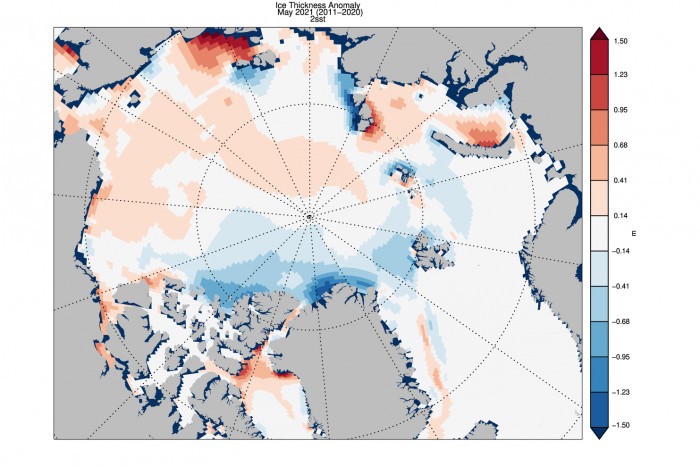
The retreat of sea-ice cover in 2021 has more to do with ambient sea-ice conditions than meteorological forcing influence. The May 2021 thickness anomaly from PIOMAS was similar to low anomaly values since 2016 and above the single record low set in 2017. Monthly ice volume was 38% below the maximum in 1979 and 25% below the mean value for 1979–2020. The ice thickness anomaly map for April 2021, relative to 2011–2020 (Figure 8, PIOMAS), shows positive anomalies along the Siberian coast, Kara Sea, and north of Alaska.
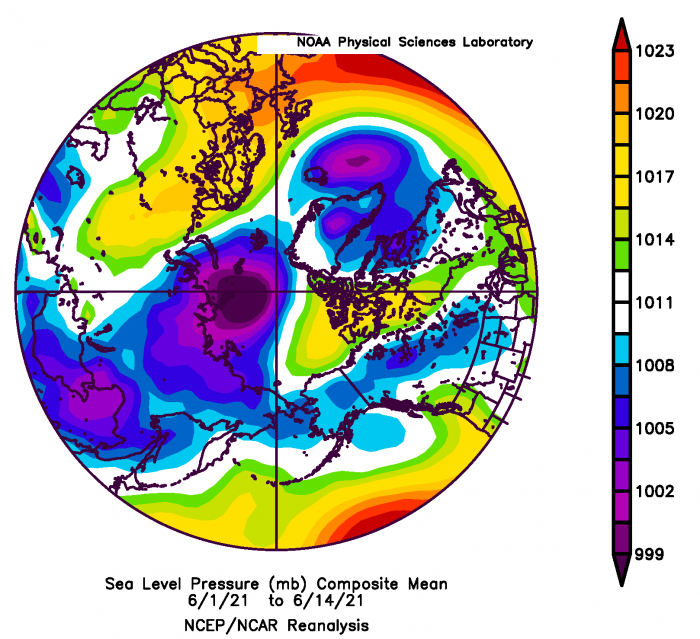
Looking forward, the 1–13 June 2021 sea level pressure map (Figure 9, ESRL/PSD) has a dipole pattern with high pressure on the North American side. This suggests continued ice loss, with currently a strong trans-polar drift and clear skies east of 180°.
The 22–28 June one-week forecast of the height of the 500 hPa surface from the Climate Forecast System shows weak winds over the central Arctic. This feature will tend to support continued loss of sea ice through at least late June. The Arctic Climate Forum-7 Consensus Statement, for comparison, completed by the World Meteorological Organization (WMO) provides seasonal projections for the Arctic at the end of May. Temperature forecasts are based on eleven models as WMO Global Producing Centers of Long-Range Forecasts and consolidated by the WMO Lead Centre for Long Range Forecast Multi-Model Ensemble. Summer 2021 calls for above-normal temperatures and sea-surface temperatures over the majority of the Arctic regions in June, July, and August. The minimum sea-ice extent is expected to be near normal for the Beaufort Sea, Chukchi Sea, and Greenland Sea; and below normal for the Barents Sea, Canadian Arctic Archipelago, Kara Sea, Laptev Sea, and Eastern Siberian Sea. Confidence is moderate or high between model projections. As the Outlooks are relative to the 2012–2020 climatology, below normal sea ice WMO Outlooks are to be expected for 2021.
In summary, the situation thus far in the 2021 retreat season and the available projections point towards substantial summer ice loss similar to recent years. The principal reason is that sea-ice extents and thickness for the Arctic as a whole are already below average.
Ocean Heat Discussion
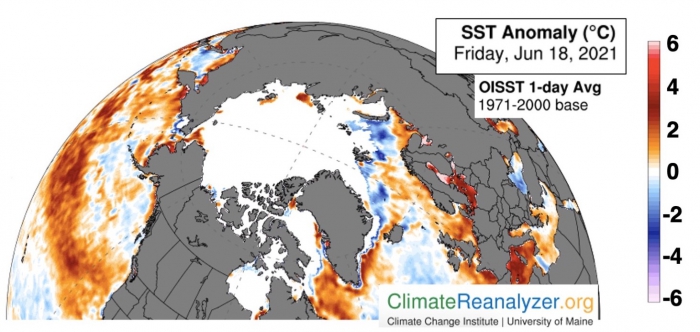
Sea surface temperature (SST) anomalies (Figure 10) generally reflect areas of anomalous sea-ice melt (i.e., compared with Figure 9), showing the effect of warm ocean currents or atmospheric heating of the ocean surface. Small areas of anomalously warm SSTs are evident in the northwestern and northeastern Laptev Sea where open water has already formed north of the Taymyr Peninsula and the New Siberian Islands, and even in a tiny spot near the coast of the eastern East Siberian Sea where open water is also present. These areas lie far away from inflowing warm waters from the North Atlantic and North Pacific Oceans, and thus are likely warmed by atmospheric solar radiation. The Chukchi Sea also has anomalously strong ice retreat and is thus warm, likely influenced by warm ocean currents flowing into the Arctic Ocean via the Bering Strait. Bering Sea SST anomalies are generally positive in the east (near Alaska).
The Barents Sea shows positive SST anomalies near the northern Scandinavian coast and the Kola Peninsula. This is likely a result of coastal currents advecting warm water from the south, as SSTs are anomalously positive all along the Norwegian coast and even into the Baltic Sea. The cause of slightly cool SSTs in the central Barents Sea is unclear—this area is south of the direct influence of sea ice, so it is likely an anomalous current pattern or air-sea heat exchange. The anomalous northward sea-ice retreat in the northern Barents Sea has not yet manifested in positive SST anomalies, but this is very likely to show up by next month's SIO report. In summary, June 2021 Arctic SSTs are generally not yet hugely anomalous one way or the other, in part influenced by fairly average spring 2021 sea-ice extent (Figure 11). Negative spring sea ice thickness anomalies (Figure 8), which could also lead to early opening and warming SSTs, were mostly centered north of the Canadian Arctic Archipelago and Greenland where ice is thick. If opening occurs at all it will be late in the summer.
Predictions from Spatial Fields Discussion
We have invited outlooks for September sea-ice probability (SIP) and first ice-free date (IFD). Additionally, SIPN2 is computing SIP and IFD from forecasts of sea-ice concentration (SIC) submitted directly by contributors, and we encourage all groups to submit full-field SIC forecasts whenever possible. We do not bias-correct any fields.
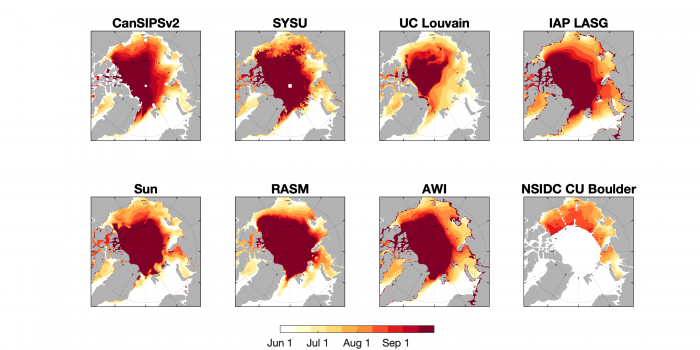
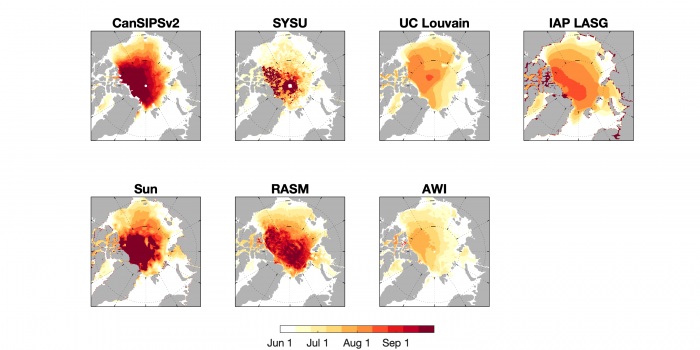
SIP is defined as the fraction of ensemble forecasts that forecast September ice concentration in excess of 15% (for example, if just four out of eight ensemble forecasts predict in excess of 15% sea ice, the SIP is 50%). IFD is the first date in the melt season at which the ice concentration at a given location first drops below a certain threshold—this year we show forecasts of IFDs for two thresholds: 15% and 80% sea-ice concentration. We show ten forecasts of SIP (7 dynamical, 3 statistical) and eight forecasts of IFD (6 dynamical, 2 statistical).
Sea-Ice Probability (SIP)
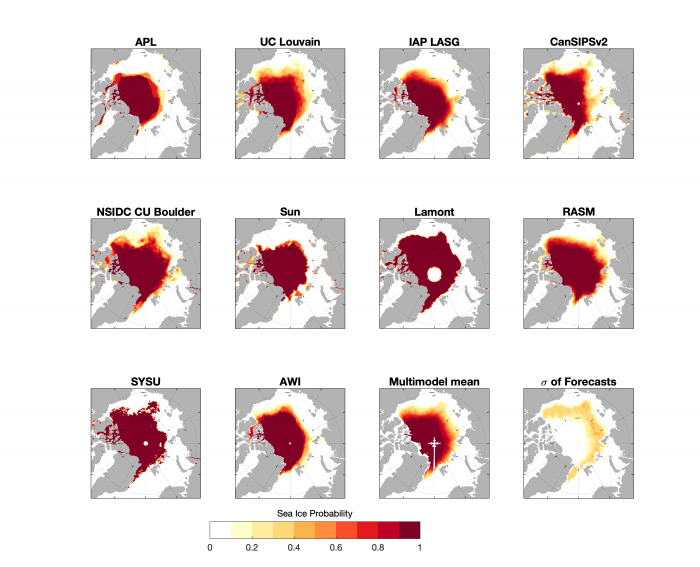
Forecasts of SIP almost unanimously agree in low September SIPs compared to past years' forecasts. Low SIPs in the Chukchi and Laptev seas are expected, and all forecasts show an open Northeast Passage. In general, forecast uncertainty is somewhat reduced compared to past years, though we note that the number of June 2021 SIP forecasts is somewhat smaller than in recent years.
First Ice-Free Date (IFD)
Figures 5 and 6 show forecasts of ice-free dates using the 15% and 80% sea ice concentration thresholds. As in past years, there is considerable forecast uncertainty of IFD in some regions. For example, some forecasts show ice-free conditions in the Laptev Sea by June (Figure 13, SYSU, Sun, CanSIPSv2), whereas other forecasts show much later melt (e.g., AWI). Forecasts also diverge in their forecasts of closed pack ice (Fig. 6 80% SIC) in the central Arctic.
Forecast Initial Conditions
Starting in 2020, we invite forecast contributors to submit their forecast initial conditions (ICs) of sea-ice concentration and sea-ice thickness to better understand how observations are being used in forecasts. For the June 2021 SIO, we have received four submissions of initial conditions, all from dynamical models (APL, CanSIPSv2, RASM, AWI), shown in Figure 7.
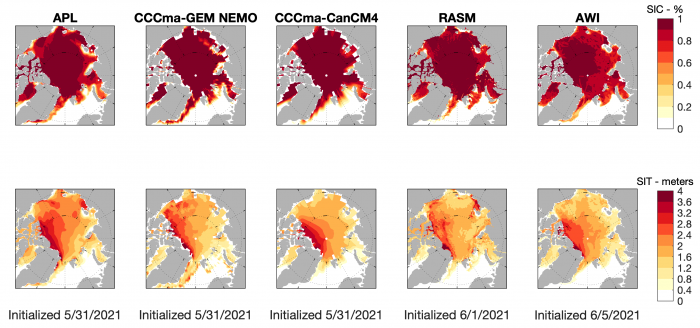
Forecast initial conditions of sea ice concentration generally show good agreement across the different models, with concentrations close to 100% over much of the Arctic Ocean. In contrast, forecast initial conditions of sea ice thickness show less agreement across models. While all models show thick sea ice north of Greenland and the Canadian Arctic Archipelago, they disagree significantly in the thickness distribution in the Pacific Arctic. Overall, the pattern of better initial conditions agreement of sea ice concentration compared to sea ice thickness is consistent with that found in 2020.
Alaska Regional Sea-Ice Extent Discussions
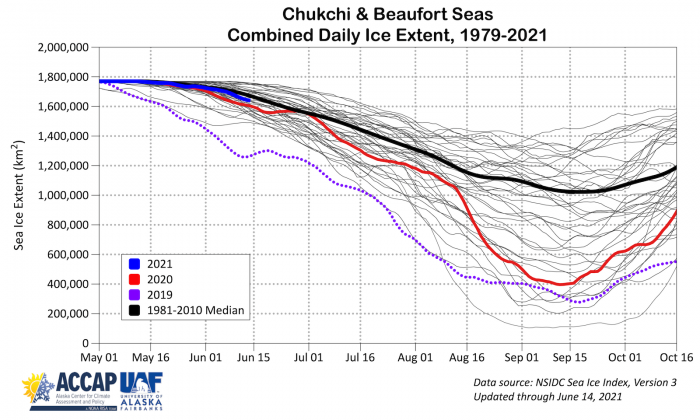
The combined Bering, Chukchi, and Beaufort sea-ice extent thus far in 2021 is slightly lower than the 1981–2010 average (Figure 16) and the retreat is much slower than the 2019 season and slightly slower than the 2020 season. The 14 June sea-ice extent in the Chukchi Sea was 0.72 million square kilometers, which is lower than the 1981–2010 median of 0.75 million square kilometers. The 14 June sea-ice extent in the Beaufort Sea was 0.916 million square kilometers and is slightly above the 1981–2010 median value (0.906 million square kilometers). Details on slower ice-retreat than in recent years have been provided by Indigenous and local sea-ice experts in coastal Alaska. In the Bering Strait region, late season snowfall in early June (https://www.arcus.org/siwo/2021-06-11) and ice lingering in coastal lagoons longer than normal have been part of sluggish melt and ice retreat (https://www.arcus.org/siwo/2021-06-18). Utqiaġvik in northern Alaska reported cool, overcast conditions for much of May and early June with slow surface ablation and much fewer sea-ice melt ponds.
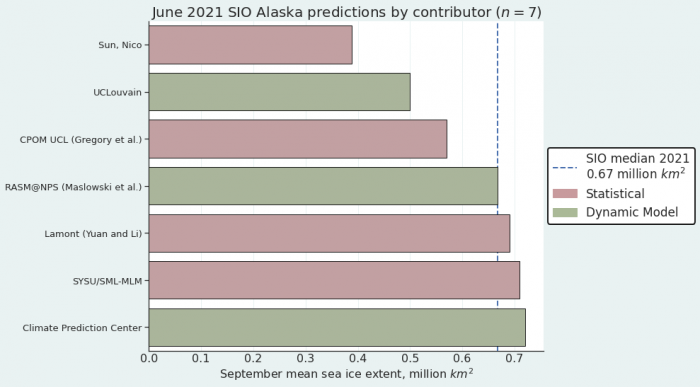
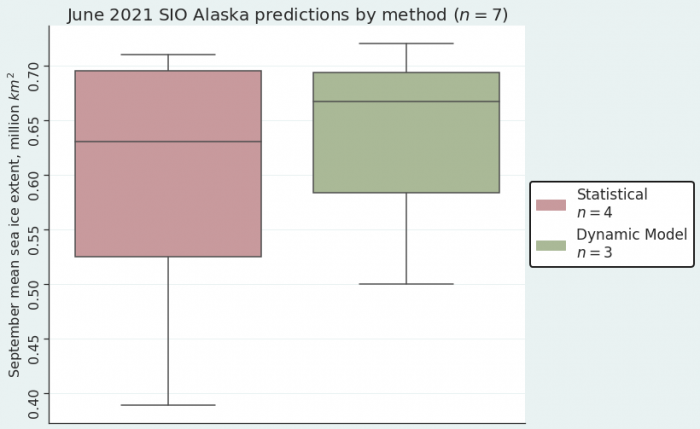
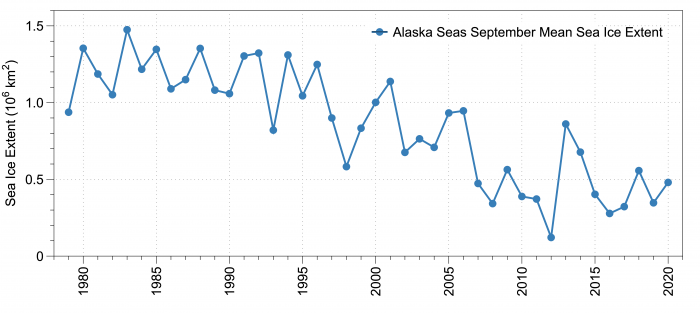
Observed September Alaska regional sea-ice extent (million square kilometers) from 1979–2020. The multimodal median for the June 2020 SIO forecasts is 0.67 million square kilometers. The dynamical model projections range from 0.5 to 0.72 million square kilometers with a mean of 0.63 million square kilometers. The statistical model projections range from 0.39 to 0.71 million square kilometers with a mean of 0.59 million square kilometers. The statistical forecasts display a larger spread (standard deviation of 0.15) compared to the dynamical models (standard deviation of 0.11) as shown in Figure 18. To put these forecasts in historical perspective, the September mean sea-ice extent for the Alaska seas (Bering, Chukchi, and Beaufort) averaged over 2007–2020 is 0.44 million square kilometers (Figure 19), making the forecasts for 2021 above all observed values since 2015.
Arctic Sea Ice Anomalies Discussion
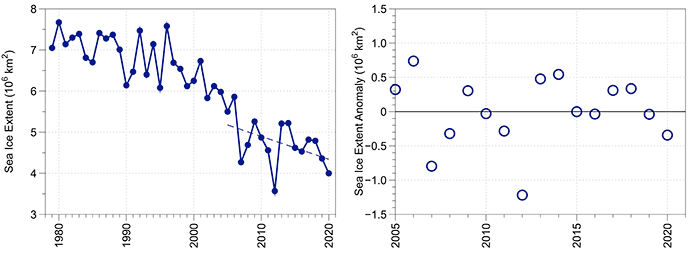
This is the first year that the SIO has solicited September mean sea-ice extent anomalies and this request emerged from the January 2021 SIO Contributor's Forum. The exercise is motivated by the large spread in SIO predictions of mean September sea-ice extent and seeks to examine if the spread is reduced when the inter-model bias is removed. The pan-Arctic sea-ice extent anomaly is the departure of the contributors' September extent Outlook relative to the contributors' baseline trend (e.g., the trend in historical observations, model hindcasts, etc.). The 14 contributions of September mean sea-ice extent anomaly range from -0.28 to +0.57 million square kilometers, with 10 forecasts above and four below the contributors' baseline (Figure 20). For historical perspective, the observed anomalies from a linear trend over the 2005–2020 period are shown in Figure 21. The observed anomalies from the trend range from -1.22 (2012) to 0.74 (2006) million square kilometers, while the June SIO anomaly forecast has a standard deviation of 0.51 million square kilometers.
Antarctic Contributions Discussion
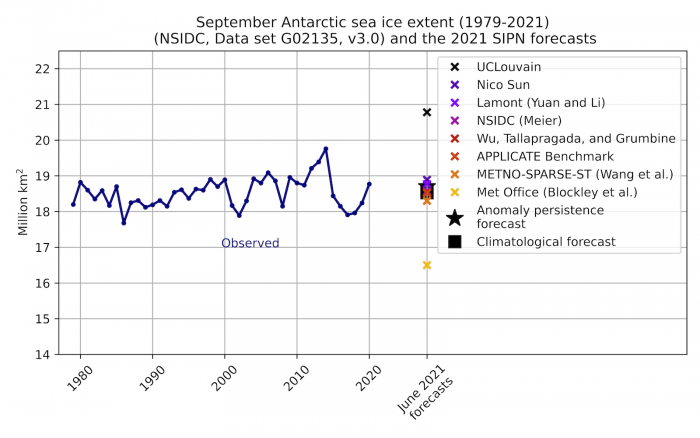
This year, eight outlooks of September mean sea-ice extent were received (same as last year). These span a range of 16.50–20.78 million square kilometers (Figure 22), which is smaller by ~25% than the range of last year (15.70-21.30 million square kilometers). However, the spread largely surpasses the range in the observed satellite record. This is a remarkable range compared to the Arctic submissions.
Interestingly, the distribution of all Antarctic outlooks is made wide by the presence of two dynamical contributions (UCLouvain and Met Office) that are not bias corrected. When these two dynamical contributions are disregarded, there is a cluster of six contributions in a narrow range (18.30–18.89 million square kilometers). In that interval, we can find one dynamical forecast (Wu, Tallapragada and Grumbine) and five statistical forecasts. Four of the five statistical forecasts apply similar methods that use past sea-ice extent (only) as a predictor, so these forecasts are not entirely independent from each other and it is therefore not surprising to have them clustered. The other statistical forecast (Nico Sun) uses both sea-ice concentration and sea-ice volume as predictors.
Initial findings from the SIPN South project (https://fmassonn.github.io/sipn-south.github.io/) suggest that for the summer season, the forecasts of sea-ice concentration from statistical forecasts are more skillful than from dynamical ones. If the same holds for winter, then we should expect close-to-average conditions in September, continuing the conditions average observed since the beginning of the year (https://nsidc.org/arcticseaicenews/charctic-interactive-sea-ice-graph/).
Discussion of SIO Contributor Motivations
The SIO serves as a hub for the sea-ice prediction community to compare notes and assess the progress of their work. At the same time, stakeholders or the interested public can gain insights into key approaches in sea-ice prediction. In preparation for the SIO contributors' forum in January of 2021, members of the SIPN2 team conducted an online survey of contributors in order to enhance our understanding of the community and how the SIO relates to their work. Approximately 40 SIO contributors were invited to complete the survey and a total of 23 contributors responded. The survey asked respondents basic questions about their organization, forecast methods utilized, motivations for contributing to the SIO, and how SIPN2 could improve the SIO. The responses paint a picture of who contributes to the SIO and why they do so. Importantly, the information shared by respondents can be utilized to enhance the SIO as an informational tool, which not only serves the research community, but can also support an array of user needs. In looking at who contributes to the SIO, most respondents are members of academic institutions (59%) or government agencies (22%). For 2020, respondents reported submitting a total of 127 monthly forecasts of all types (i.e., SIE, SIP, IAD, IFD). A total of 51 monthly forecasts for Pan-Arctic sea-ice extent and 24 submissions for SIP were reported by respondents. To better understand the role that the SIO plays in supporting contributor research, respondents were asked to identify the reasons (more than one reason could be provided) why they submitted forecasts. Of the 23 respondents, 16 indicated that they submitted to the SIO in order to compare their forecasts against those of other community members and 14 respondents (60.9%) indicated that they submitted a forecast to increase the profile of their organization. The continued evolution of the SIO depends on the feedback provided by the sea-ice forecasting community. The insights shared shed light on areas of value which can be utilized to enhance outreach in the future.
Predicting Predictions: An Emerging Pattern in the Sea Ice Outlooks
Looking back at the 13-year long (2008–2020) record of all June Sea Ice Outlooks (Figure 23), it is striking to note the lack of correspondence between the median of all outlooks and the actual September observed value: the two time series correlate at r = 0.24, indicating a lack of skill in predicting the interannual variations of sea-ice extent. Hamilton and Stroeve (2016) have proposed the idea that the SIO is able to forecast the forced changes in sea-ice extent (i.e., values close to the trend line or the local average), while predicting anomalous conditions such as in 2012 or 2013, remains extremely difficult. During years for which the September sea-ice extent departs significantly from the previous year's value, errors tend to be larger (Fig. 5 of Hamilton and Stroeve 2016), which confirms this intuition.
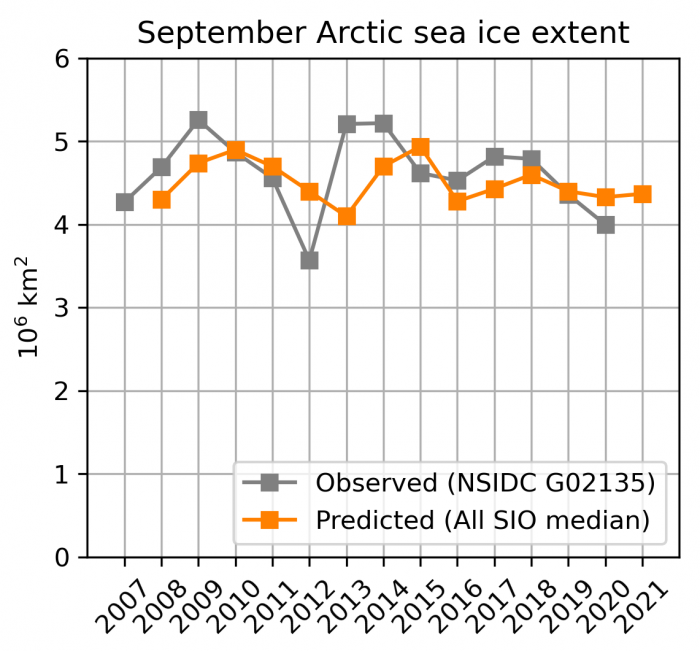
While there is no significant association between predicted and observed time series, Figure 23 hints at the fact that the two time series seem to exhibit one-year lagged covariability. Actually, the observed and predicted time series correlate significantly (r = 0.86) when introducing a one-year lag difference. That is, the observed September extent of a given year is a very good predictor of the Sea Ice Outlook prediction issued the next year. This relationship is depicted in Figure 24.
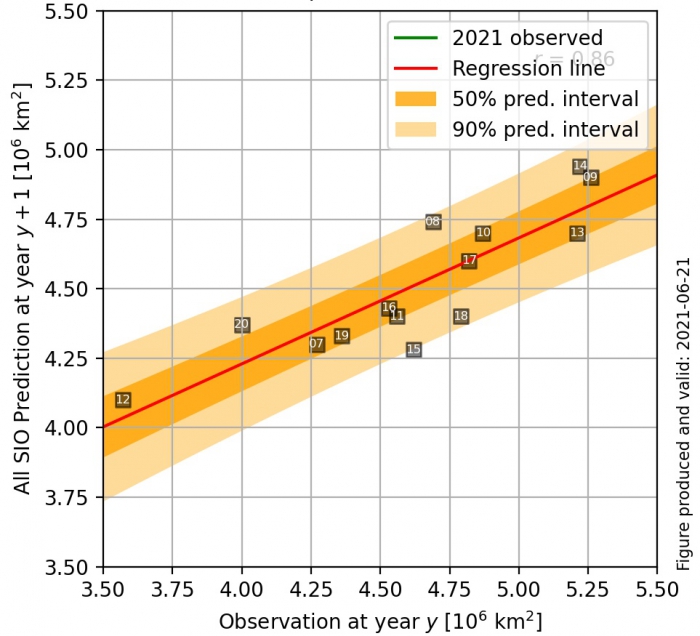
How to explain this relationship? A possibility is that, as a crowd, the community providing SIO outlooks keeps a memory of how anomalous last year was. For example, after the 2012 all-time minimum, several groups may have updated their forecasting system (consciously or not) because such a low value then became a distinct possibility. While this behavior is justified, a worrying reality is that the observed September sea-ice extent anomalies do not exhibit significant one-year memory (r = 0.03 for the one-year lagged 2007–2020 observed time series), so that using last year's observed value as an outlook for next year is equivalent to contributing a climatological forecast.
One might think that the association seen in Figure 24 is driven by a subset of forecasts. That is not the case: a relationship exists in dynamical (r = 0.77), statistical (r = 0.79) and to a lesser extent hybrid (r = 0.41) contributions. The "Mixed" and "Machine Learning" categories do not offer enough data points to compute reliable statistics.
References
Hamilton, L. C., and Stroeve, J. 2016. 400 predictions: The SEARCH Sea Ice Outlook 2008–2015. Polar Geography 39(4): 274–287. https://doi.org/10.1080/1088937X.2016.1234518
Contributor Full Report PDFs and Supplemental Material
| Attachment | Size |
|---|---|
| 2021 SIO June Executive Summary Reports89.12 KB | 89.12 KB |
This report was developed by the SIPN2 Leadership Team
Report Leads
Muyin Wang, University of Washington and the Joint Institute for the Study of the Atmosphere at the University of Washington
Jim Overland, NOAA/Pacific Marine Environmental Laboratory
Additional Contributors:
Richard Thoman, Alaska Center for Climate Assessment and Policy, International Arctic Research Center, University of Alaska
Matthew Fisher, Cooperative Institute for Research in Environmental Sciences at the University of Colorado Boulder, NSIDC
Editors:
Betsy Turner-Bogren, ARCUS
Helen Wiggins, ARCUS
Stacey Stoudt, ARCUS
Lisa Sheffield Guy, ARCUS
Suggested Citation:
Wang, M. and Overland, J.E., U.S. Bhatt, P. Bieniek, E. Blanchard-Wrigglesworth, H. Eicken, M. Fisher, L. C. Hamilton, J. Little, F. Massonnet, W. Meier, M. Serreze, M. Steele, J. Stroeve, R. Thoman, J. Walsh, and H. V. Wiggins. Editors: Turner-Bogren, B., L., Sheffield Guy, J.K. Grzeda, S. Stoudt, and H. V. Wiggins. June 2021. "Sea Ice Outlook: 2021 June Report." (Published online at: https://www.arcus.org/sipn/sea-ice-outlook/2021/june.)
This Sea Ice Outlook Report is a product of the Sea Ice Prediction Network–Phase 2 (SIPN2), which is supported in part by the National Science Foundation under Grant No. OPP-1748308. Any opinions, findings, and conclusions or recommendations expressed in this material are those of the author(s) and do not necessarily reflect the views of the National Science Foundation.


